ARCHIVED
GLOBAL COAL FINANCE
About this content
The following is a literature review of key studies on global coal finance. Additional information and findings of many more studies can be found in the full report and bibliography. The research is current to 30 November 2017.
Scale of the coal industry
Coal mining
Coal power
Who owns the coal industry?
Coal mining
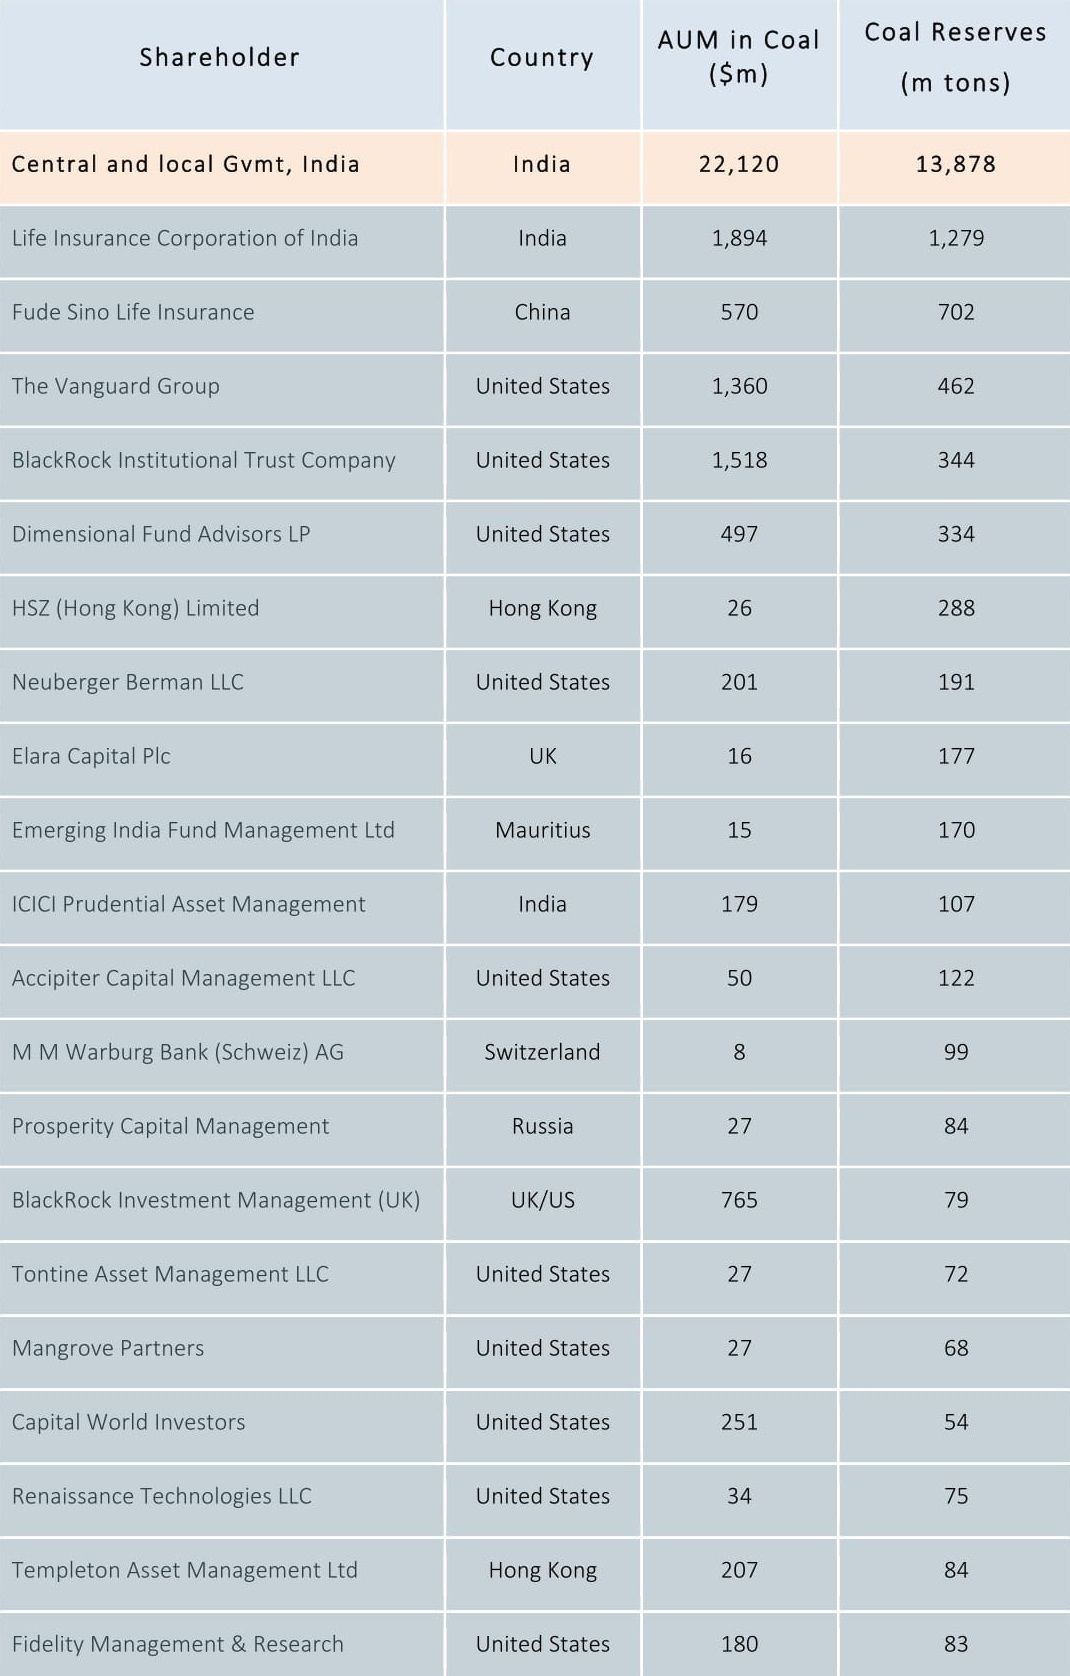


The IEA estimate 15% of global coal production to be coking coal and the remaining 85% thermal coal.
Influence Map provides information about the ownership of 1/2 of the total global thermal coal production, constituting 117 listed companies, with the ownership of the remaining 1/2 unknown.
Influence map divides investors into “Strategic” investors (e.g. governments, power companies) that have a reason to be invested beyond a financial return, and “Non-Strategic” investors (e.g. fund managers) who are primarily seeking a return on equity.
Non-strategic Investors in coal mining companies by coal reserves (M Tons)
Source: Influence Map, 2017
| Investor | Type | Country | Coal reserves (m tons) | |
|---|---|---|---|---|
| 1. | Life Insurance Corporation of India | State | India | 1,279 |
| 2. | Fude Sino Life Insurance | Private | China | 702 |
| 3. | The Vanguard Group | Private | United States | 462 |
| 4. | BlackRock Institutional Trust Company | Private | United States | 344 |
| 5. | Dimensional Fund Advisors LP | Private | United States | 334 |
| 6. | HSZ (Hong Kong) Limited | Private | Hong Kong | 288 |
| 7. | Neuberger Berman LLC | Private | United States | 191 |
| 8. | Elara Capital Plc | Private | UK | 177 |
| 9. | Emerging India Fund Management Ltd | Private | Mauritius | 170 |
| 10. | Accipiter Capital Management Ltd | Private | United States | 122 |
| 11. | ICICI Prudential Asset Management | Private | India | 107 |
| 12. | M M Warburg Bank (Schweiz) AG | Private | Switzerland | 99 |
| 13. | Prosperity Capital Management | State | Russia | 84 |
| 14. | Templeton Asset Management Ltd | Private | Hong Kong | 84 |
| 15. | Fidelity Managment & Research | Private | United States | 83 |
| 16. | BlackRock Investment Management (UK) | Private | UK/US | 79 |
| 17. | Renaissance Technologies LLC | Private | United States | 75 |
| 18. | Tontine Asset Management LLC | Private | United States | 72 |
| 19. | Mangrove Partners | Private | United States | 68 |
| 20. | Capital World Investors | Private | United States | 54 |
| Example of strategic investor: | ||||
| Central and local government, India | State | India | 13,878 | |
Influence Map provides information on the non-strategic investors. The largest non-strategic investors by coal reserve are listed in the table opposite.
In comparison, listed is an example of a strategic investor, the Central and local Governments in India.
Coal power
Analysis of the companies representing half of global total by coal power expansion plans
Source: Global Coal Exit List, 2017
Graph below: 40 unlisted companies seeking to expand coal power, indicating country of headquarters and ownership status (as identified in the Global Coal Exit List)

Table below: top 20 shareholders of the 17 listed companies seeking to expand coal power (as identified in the Global Coal Exit List, data provided by GSCC)
| Investor | Type | Country | Amount (US$ bn) | |
|---|---|---|---|---|
| 1. | Government of India | State | India | $19.63 |
| 2. | Shanghai Electric Group | Private | China | $ 8.18 |
| 3. | Korea Development Bank | State | South Korea | $ 7.18 |
| 4. | CRH Power | Private | China | $ 5.87 |
| 5. | Khazanah Nasional Bhd | State | Malaysia | $ 5.60 |
| 6. | Life Insurance Corporation of India | State | India | $ 4.21 |
| 7. | Ministry of Strategy and Finance Korea | State | South Korea | $ 3.97 |
| 8. | Poland State Treasury | State | Poland | $ 3.52 |
| 9. | Lawrencium Mikado Holdings | Private | Hong Kong | $ 2.37 |
| 10. | Adani Gautam | Private | India | $ 2.26 |
| 11. | OAK CLP | Private | Hong Kong | $ 2.22 |
| 12. | Employees Provident Fund | State | Malaysia | $ 2.22 |
| 13. | Vanguard Group | Private | USA | $ 2.10 |
| 14. | Government Pension Investment Fund Japan | State | Japan | $ 1.93 |
| 15. | Roseneftegaz | State | Russia | $ 1.78 |
| 16. | Lawrencium Holdings | Private | Hong Kong | $ 1.73 |
| 17. | Blackrock Fund Advisors | Private | USA | $ 1.53 |
| 18. | National Pension Service Korea | State | South Korea | $ 1.42 |
| 19. | INTER RAO Capital | State | Russia | $ 1.35 |
| 20. | Skim Amanah Saham Bumiputera | State | Malaysia | $ 1.32 |
The role of corporate v project finance
Coal mining
- Fossil fuel supply finance 2011 (IEA) 95%
- Fossil fuel supply finance 2016 (IEA) 93%
According to International Energy Agency, World Energy Investment (2017), most coal mining investment takes the form of balance sheet (corporate) finance.
Coal power

International Energy Agency, World Energy Investment,
2017
- Thermal power generation finance 2011 83%
- Thermal power generation finance 2016 78%
Note the contrasting conclusions in these two sources of information, indicating the difficulty in quantifying the split between project and balance sheet finance. However, both point to the dominant role of corporate finance in coal power.
Public and private debt finance
Coal mining

Commercial bank lending to coal mining, 2014-2016
Source: RAN, BankTrack, Oil Change, Sierra Club, Banking on Climate Change, 2017

Coal power

Commercial bank lending to coal power, 2014-2016
Source: RAN, BankTrack, Oil Change, Sierra Club, Banking on Climate Change 2017
Maturity of Loans and Bonds
Maturity Profiles of Bonds and Loans to Coal Mining Companies from 2017 to 2022
Source: Data provided by GSCC, 2017
Equity raising
Companies will often turn to the equity market to raise capital before seeking more debt finance, as the equity can be leveraged many times over. While equity is often sourced from existing shareholders, companies will seek additional investment through further share issuances. There is no comprehensive study on the role of equity raising in coal finance at this stage.
Trends: China, Japan and Korea’s new coal race
")
")
Source: IEA Clean Coal Center, 2017
Study of 21 new coal-fired power stations in Indonesia financed since 2010


Source: Market Forces, 2017
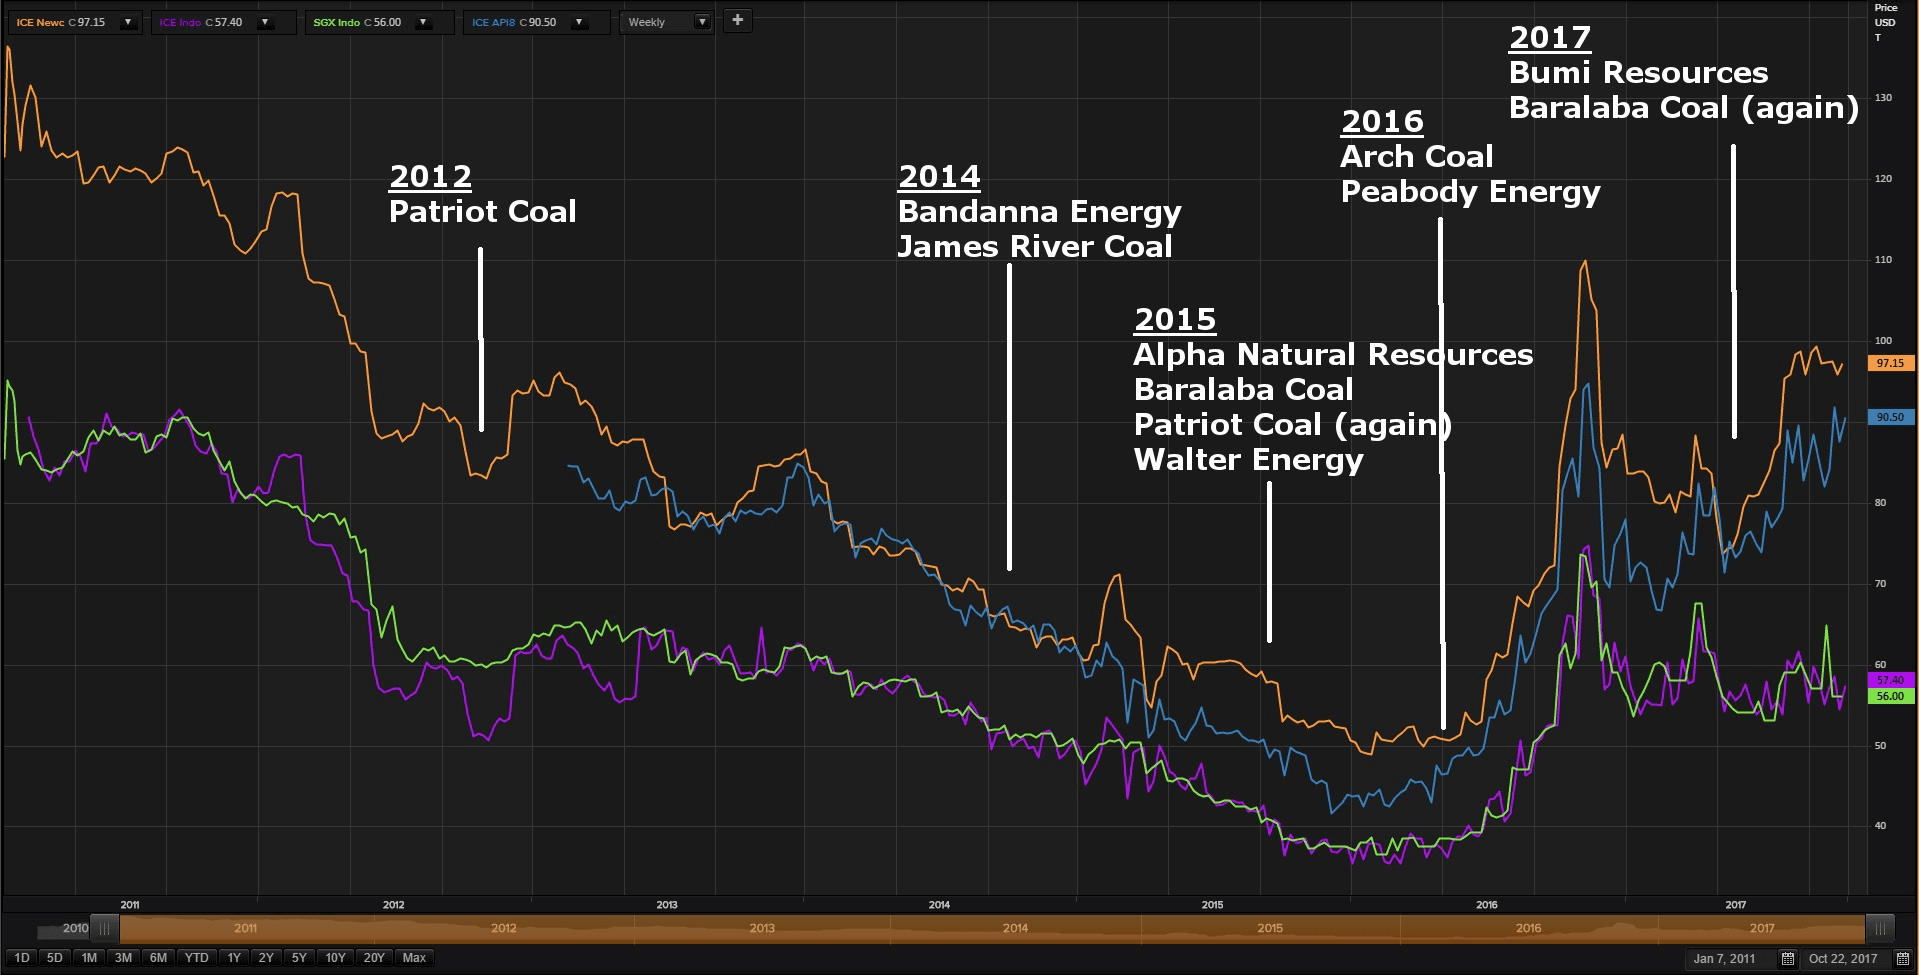
Trends: Corporate restructuring
Your content goes here. Edit or remove this text inline or in the module Content settings. You can also style every aspect of this content in the module Design settings and even apply custom CSS to this text in the module Advanced settings.
Bankruptcies are clearly a sign of distress for coal mining companies, but do not mean the end of the companies or their operations.
Rather, bankruptcies are often part of corporate restructuring during which operations can continue. The intention of a company emerging from bankruptcy is to be in a more secure and healthier financial state.
Chart source: TR Eikon, 2017
")
Shenhua Group and China Guodian have merged, creating a company with a combined capacity portfolio of 221 to 225GW, and 500 million tons of coal per year.
Other major M&A activity includes:
- Arclight acquisition of AEP’s power plants in US.
- Vale sale of Mozambique coal mines to Mitsui.
- Yancoal acquisition of Coal & Allied Industries.
- Enel’s 10% stake in Bayan Resources acquired by the company’s founder.
Trends: Project bonds
At this stage, this debt instrument does not seem significant to global coal finance at present. However, companies may use more project bonds to raise debt
- in Asia;
- in refinancings; and
- following the Basel III regulations coming into effect.
Anatomy of a Project Bond: Paiton Energy, US$2bn, August 2017
Source: Project Finance International, 2017
The breakdown of the investors in the 2010 loan:
The breakdown of the investors in the 2017 bond:
")
")
Could coal projects be financed by green bonds?
- Voluntary Green Bonds Principles (which include renewable energy and pollution prevention and control) recommend external review.
- ASEAN framework of green bonds standards specifically exclude funding of fossil fuels.
- However, Chinese coal power plant producer Tianjin SDIC Jinneng Electric Power registered short-term “green bonds” on interbank market for $USD150M to finance a 2,000MW coal-fired power plant in Tianjin.
Country by country
Click here to view Prezi in full screen.
Key takeaways
- The nature of coal finance varies wildly between countries.
- Importance of China and Chinese finance.
- Importance of corporate or balance sheet finance.
- In several key coal power growth markets, public finance unlocks commercial debt.
- In areas like India, Turkey, Australia, domestic banks are key.
Key studies
350 Japan, Energy Finance in Japan: Funding Climate Change and Nuclear Risk, August 2017
- Investigates investment in fossil fuel sector selecting 17 fossil fuel companies and to 12 nuclear sector companies.
- Looked at which financial institutions provided loans and underwriting to the fossil fuel sector, with Mizuho, Sumitomo Mitsui Financial and Mitsubishi UFJ Financial providing the largest percentage of finance.
- Available online.
BP Statistical Review of World Energy, 2017
- Provides information on a country-by-country basis on the proven reserves, production and consumption.
- Provides analysis of reserve to production ratios, production and consumption by region.
- Maps coal prices in the region.
- Available online.
EndCoal, Global Coal Plant Tracker, July 2017
- Provides information on coal plants by country (MW).
- Includes units 30MW and larger, and divides them into announced, pre-permit, permitted, construction, shelved, operating and cancelled.
- Available online.
Global Coal Exit List, Urgewald, November 2017
- Provides a “who is who” of the global coal industry by providing key statistics on 775 companies.
- “All in all, the companies listed in the GCEL represent over 88% of world coal production and 86% of the world’s coal-fired capacity.”
- provides information about which companies are planning new coal projects, 225 expanding coal mining and 282 planning new coal-fired power stations.
- Available online.
GreenID, A Study of Financiers of Coal Power in Vietnam, October 2016
- Provides an overview of investment in coal power.
- Summarises the investment in 65 Vietnamese power plants: by investors and EPCs including their country of origin and value of their investment.
- Available on request.
IEA Clean Coal Centre, International Finance for Coal-fired Power Plants, April 2017
- Provides a “brief introduction to project finance and debt instruments”, and the global trends in coal finance.
- Discusses “a geographical shift from western banks as the lead arrangers of project finance, towards Asian institutions taking greater leadership.” Specifically, the report talks about Japan, Korea and China pursuing coal project to export their own technology and using Asian public finance institutions to finance these projects.
- Available for purchase here.
IEA World Energy Investment, 2017
- Looks at total investment into energy: “Total energy investment worldwide in 2016 was just over $1.7 trillion, accounting for 2.2% of global GDP. Investment was down by 12% compared to IEA’s revised 2015 energy investment estimate of $1.9 trillion.”
- Reviews investment regionally.
- Looks at trends in specific energy sectors and the lowered investment in coal-fired power plants (nearly 20 GW less commissioned).
- States playing a key role in energy investments.
- Balance sheet finance more important than project finance in the energy sector.
- Available for purchase here.
IEEFA, Global Electricity Utilities in Transition: Leaders and Laggards: 11 Case Studies, October 2017
- Provides a summary of 11 major utilities in transition: Enel, Engie, NRG, NextEra, Engie, RWE, E.ON, AGL, NTPC, CEIC, TEPCO and Eskom and classifies them under renewable energy leaders, belated transition underway and laggards not modernizing.
- Provides a good overview of factors affecting each utility, and the impact of wholesale electricity prices being pushed down by the rise of renewable generation.
- Available online.
IEEFA, Turkey at a Crossroads: Invest in the Old Energy Economy or the New, June 2016
- Discusses the rapid power plant buildout as putting upward pressure on low electricity prices.
- Provides that a new proposed coal subsidy would cost US$1.1 to 2 billion dollars annually and raise the electricity prices as much as 29%.
- The potential for defaults and stranded assets would undermine the Turkish banking sector.
- Advocates for Turkey to seriously consider its renewables potential.
- Available online.
Influence Map, Who Owns the World's Coal, May 2017
- Discusses geographical spread of ownership of thermal coal producing companies.
- Divestment and Pension Funds: assessing coal divestment statements and assessing their progress, “finding good compliance with the coal specific divestment statements from investors aggregating $1.4tn AUM.”
- Discusses the nature of shareholders of thermal coal: “(1) strategic investors from Asia, (gvmts, power companies) (2) BlackRock and Vanguard (who own assets through the sheer size of their global holdings) and (3) mid size asset managers and funds who may see opportunity in US resurgence and Asian growth.”
- Available online.
Market Forces, Foreign Finance to Indonesian Coal, June 2017
- Reviewed deals comprising “debt finance to 21 coal power projects with a combined capacity of 13.1GW, which reached financial close from January 2010 to March 2017”.
- “Export Credit Agencies participated in 64% of deals and loaned 45% of total debt. Bilateral Development Banks participated in 27% of deals, lending 19% of overall debt.”
- “The power plants studies were majority foreign owned. 51% of the overall project value was owned by Japanese and Chinese companies, with 39% Indonesian-owned.”
- Available online.
Oil Change International, Shift the Subsidies Database, 2017
- The database tracks public financial flows from public financial institutions around the world from 2008 to 2015(over 7,000 energy finance transactions).
- Includes information on major multilateral development banks (2008 to 2015), bilateral financing agencies of the US (2008 to 2015), and Bilateral Financing Agencies of the other G20 countries (from 2013 to 2015) tracking their fossil fuel and clean energy finance.
- Available on request here.
RAN et al, Banking on Climate Change, 2017
- This report represents the 8th Annual Fossil Fuel Finance Report Card.
- It “grades fossil fuel policies and tabulates financing from 37 major private banks from across Europe, the United States, Canada, Japan, China, and Australia.”
- For coal mining: “The world’s top 40 coal mining companies
by annual production.” - For coal power: “The top 10 companies by megawatts of operating coal-fired capacity in the Americas; the top 10 in Europe, the Middle East, and Africa; and the top 10 in Asia and Oceania.”
- The banks analyzed in this report funneled USD $92 billion to
extreme fossil fuels in 2014, USD $111 billion in 2015 and $87 billion in 2016 (representing a 22 percent decrease). - Available online.
US Energy Administration Agency, Annual Coal Report 2016, November 2017
- Presents “annual data on U.S. coal production, number of mines, productive capacity, recoverable reserves, employment, productivity, consumption, stocks, and prices.”
- “In 2016, U.S. coal production dropped 18.8% year-over year to 728.4 million short tons, the lowest annual production level since 1979.”
- Available online.