ARCHIVED CONTENT
Acland coal mine. Image credit: Lock the Gate (CC BY 2.0)
This report was published in September 2021. The data in the report covers the timeframe 1 Jan 2016 – 31 Dec 2020.
In December 2015 nearly 200 nations signed the Paris Agreement, aiming to limit global warming to 1.5°C compared with pre-industrial levels.
Since then, the world has recorded its five hottest years. Half the Great Barrier Reef corals died in back-to-back mass bleaching events. Australia experienced some of its worst bushfires on record, and wildfires devastated California and swathes of Europe. And the world’s foremost climate science body, the IPCC, issued its starkest warning yet of the dire impacts of climate change if swift and significant action isn’t taken.
Australia’s ‘big four’ banks – ANZ, CommBank, NAB and Westpac – have all publicly championed the Paris Agreement. They have also committed to the global goal of net zero emissions by 2050, even though the current state of climate science means we should be aiming for net-zero emissions far sooner.
But their actions are failing to satisfy either of these commitments.
In May 2021, the International Energy Agency (IEA) gave us the best insight yet of the rapid energy transition required to achieve net-zero emissions by 2050. The conclusion is clear: there is no room for new or expanded coal, oil and gas projects.
Despite this, Australia’s major banks have continued undermining their own climate commitments. In 2020 the big four loaned:
- $8.9 billion to the dirty coal, oil and gas industry, up 18% since 2019, bringing the total amount loaned since 2016 to $44.4 billion,
- $835 million for projects that expand the fossil fuel industry, enabling an additional 1.1 billion tonnes of CO2 to be released into our atmosphere, and
- $1.3 billion to major Australian fossil fuel companies pursuing plans consistent with the failure of the Paris Agreement, including $464 million to some of the most climate-destructive companies in Australia; Whitehaven Coal and Santos.
Worse still, if Australian fossil fuel companies get their way, they will enable emissions equivalent to 146 times Australia’s annual carbon footprint. These companies and others are pursuing at least another 116 new or expansionary fossil fuel projects in Australia that would cost more than $200 billion, including Whitehaven’s Vickery coal mine, New Hope’s New Acland Stage 3, Woodside’s Burrup Hub, and Santos’s Narrabri Gas Project. If we’re to have a fighting chance to limit warming to 1.5°C, we must ensure the banks do not fund these climate-destructive companies or their dirty fossil fuel expansions.
TAKE ACTION!
Tell your bank: net-zero by 2050 and the Paris Agreement means no more fossil fuels!
If you’re not a customer or shareholder of one of the big four, click the “All Banks” tab below to send all four banks a message.
![]()
Tell ANZ our climate can’t afford new fossil fuels!
![]()
Tell Commonwealth Bank our climate can’t afford new fossil fuels!
![]()
Tell NAB our climate can’t afford new fossil fuels!
![]()
Tell Westpac our climate can’t afford new fossil fuels!
Tell the banks our climate can’t afford new fossil fuels!
Contents
- Banks’ climate promises
- Climate Scorecard: Bank actions since January 2016
- Climate Scorecard: Bank policies
- Funding Australia’s most climate-wrecking companies
- Big banks make a mockery of climate commitments by funding new fossil fuels
- Climate impact of new fossil fuels
- Fossil fuel lending too high, renewables lending too low
- Policy laggards
- Banks breaching their own policies?
- Methodology

Banks’ climate promises
The big four banks have all supported the Paris Agreement and the goal of net zero by 2050. Find their commitments below, and read on to learn why the banks haven’t lived up to their promises and how they should improve.
“ANZ’s Climate Change Statement reaffirms support for the Paris Agreement goals and the transition to a net-zero carbon economy” – ANZ
“We are committed to playing our part in limiting climate change in line with the goals of the Paris Agreement and supporting the responsible global transition to net zero emissions by 2050” – CommBank
“We are aligning our business with the goals of the Paris Agreement: to keep global warming to less than two degrees Celsius, striving for no more than 1.5 degrees Celsius above pre-industrial levels and supporting a just transition to a net zero emissions economy by 2050.” – NAB
“We are committed to managing our business in alignment with our support for the Paris Climate Agreement and the need to transition to a net zero emissions economy by 2050.” – Westpac
Climate Scorecard: Bank actions since
January 2016
Total lending to fossil fuels
$13,978 million
$14,202 million
$9,547 million
$6,689 million
Lending to companies with business plans consistent with the Paris Agreement’s failure
$2,785 million
$2,405 million
$1,996 million
$2,121 million
Lending to expansionary projects
$2,446 million
$3,060 million
$1,472 million
$861 million
Fossil fuels vs renewables lending ratio
$6.20 : $1
$3.63 : $1
$1.46 : $1
$2.93 : $1
Total emissions enabled from expansionary projects (tonnes CO2)
4.6 billion
5.8 billion
3.6 billion
2.3 billion
The data in this report covers the timeframe 1 Jan 2016 – 31 Dec 2020
Climate Scorecard: Bank actions since January 2016
Total lending to fossil fuels
$13,978 million
$14,202 million
$9,547 million
$6,689 million
Lending to companies with business plans consistent with the Paris Agreement’s failure
$2,785 million
$2,405 million
$1,996 million
$2,121 million
Lending to expansionary projects
$2,446 million
$3,060 million
$1,472 million
$861 million
Fossil fuels vs renewables lending ratio
$6.20 : $1
$3.63 : $1
$1.46 : $1
$2.93 : $1
Total emissions enabled from expansionary projects (tonnes CO2)
4.6 billion
5.8 billion
3.6 billion
2.3 billion
The data in this report covers the timeframe 1 Jan 2016 – 31 Dec 2020
Climate Scorecard: Bank policies
Rules out funding companies with business plans consistent with the failure of the Paris Agreement?
No
No
No
No
Rules out funding new or expansionary fossil fuels?
No
No
No
No
Plans to phase out all fossil fuel exposure in line with the Paris Agreement?
No
No
No
No
Plans to exit thermal coal by 2030?
Yes
Yes
Yes*
Yes
The data in this report covers the timeframe 1 Jan 2016 – 31 Dec 2020
*NAB updated its thermal coal policy in November 2021.
Total lending to fossil fuels since Jan 2016
The data in this report covers the timeframe 1 Jan 2016 – 31 Dec 2020
1.5°C and net zero require the rapid decline of fossil fuels
The Paris Agreement’s 1.5°C warming limit, and the net zero by 2050 goal supported by the big banks, have major implications for the world’s energy system. These implications must be reflected in the financing decisions of our major banks.
In May 2021, the International Energy Agency (IEA) gave us the best insight yet of the rapid energy transition required to achieve net zero emissions by 2050. The conclusion is clear: there is no room for new or expanded coal, oil and gas projects.
Although the IEA sees “huge declines in the use of coal, oil and gas” in its net zero by 2050 scenario, limiting warming to 1.5°C means these declines must be even steeper. This is because recent analysis shows we must achieve net zero sooner than 2050 to avoid exceeding this limit.
The declining role of fossil fuels necessary to cap warming at 1.5°C is modelled by the Intergovernmental Panel on Climate Change (IPCC). The model finds the role of gas must decline 25% by 2030 and 74% by 2050, while oil must decline 37% by 2030 and 87% by 2050 (relative to a 2010 baseline). Meanwhile, energy from coal must decline 78% by 2030 and 97% by 2050.
Clearly our banks must immediately stop funding companies and projects expanding the fossil fuel industry, and align their finance with 1.5°C (and net zero by 2050 as a minimum interim step), if their own commitments to support the Paris Agreement are to be taken seriously.
“There are no new oil and gas fields approved for development in our [Net Zero Emissions by 2050] pathway, and no new coal mines or mine extensions are required.”
“Net zero means huge declines in the use of coal, oil and gas.”
– International Energy Agency (IEA), May 2021
“We have no room to build anything that emits CO2 emissions.”
– Fatih Birol, Executive Director, International Energy Agency (IEA), November 2018
Funding Australia’s most climate-wrecking companies
Despite their climate promises, and the rapid decline of fossil fuels necessary to achieve the Paris Agreement and net zero by 2050, since 2016 Australia’s major banks have loaned $9.3 billion to 17 of the 23 major Australian fossil fuel companies pursuing plans consistent with the failure of the Paris Agreement.
These 23 companies are undermining climate action by:
- Expanding the scale of the fossil fuel sector; and/or
- Relying on scenarios consistent with the failure of the Paris Agreement to justify their future business prospects.
Worse still, both ANZ and CommBank have policies that reward these companies, allowing the banks to continue them until at least 2025!
Lending to companies out of line with the Paris Agreement since Jan 2016
Banks’ connections to companies out of line with the Paris Agreement since Jan 2016
| wdt_ID | Out of line companies | Banks |
|---|---|---|
| 1 | AGL Energy | ANZ, CommBank, NAB, Westpac |
| 2 | APA Group | ANZ, CommBank, NAB, Westpac |
| 3 | Aurizon | ANZ, CommBank, NAB, Westpac |
| 4 | Beach Energy | ANZ, CommBank, NAB, Westpac |
| 5 | Cooper Energy | ANZ, NAB |
| 6 | Mineral Resources | CommBank, NAB, Westpac |
| 7 | New Hope Corporation | ANZ, NAB |
| 8 | Oil Search | ANZ, CommBank, NAB, Westpac |
| 9 | Origin Energy | ANZ, CommBank, NAB, Westpac |
| 10 | Santos | ANZ, CommBank, NAB, Westpac |
Four belligerent climate pariahs
As detailed below, some of the most community- and climate-destructive companies are Whitehaven Coal, New Hope, Woodside and Santos.
The major banks have loaned a combined $2.8 billion to these climate-wrecking companies since 2016. ANZ is leading the charge, having loaned $952 million across all four companies, followed closely by CommBank with $944 million across Santos and Woodside, while NAB and Westpac loaned approximately $450 million each across three companies.
Learn more about each of these four climate-wrecking companies, and the banks’ recent funding for them, below:
Whitehaven Coal
Whitehaven Coal is the biggest pure play coal miner on the Australian share market and is planning to spend almost $2 billion on three proposed climate-wrecking coal mines and expansions: Vickery, Narrabri Stage 3 and Winchester South. Over their lifetimes these three mines would unleash almost 1.1 billion tonnes of carbon emissions, the equivalent of almost twice Australia’s annual emissions.
In the last five years Whitehaven has more than doubled its production and these new mines would see Whitehaven producing around twice as much coal as it does today well into the 2040s. To justify these dirty coal expansions, Whitehaven regularly refers to coal demand scenarios that rely on the failure of the Paris Agreement and are consistent with around 3ºC of global warming by 2100.
CommBank and ANZ have ceased participation in key funding deals for the company in recent years, while NAB and Westpac loaned Whitehaven a combined $220 million as recently as February 2020.
Destroying the environment and breaking laws
Farmers near the Maules Creek coal mine are deeply concerned that Whitehaven’s water use is drying out streams and bores. Local farmers have been repeatedly outbid on water licences with Whitehaven paying five times the market value at times for water. In April 2021, Whitehaven pleaded guilty to taking one billion litres of water during a severe drought in New South Wales.
This is not the first time Whitehaven has broken the law. The company’s mines are renowned for a litany of environmental breaches, many of which Whitehaven sought to keep secret. The incidents range in severity but many involve breaches of conditions that are imposed to protect communities and the environment from the impacts of mining. In August 2021, Whitehaven was fined $372,500 for 19 breaches of its licence, including failures to rehabilitate drill sites and drilling bores that did not meet approval conditions.
Learn more and take action on Whitehaven here.

Whitehaven Coal’s Narrabri Mine. Credit: Maps data: Google, C 12/8/18 CNES / Airbus
Video: ‘Whitehaven Coal can’t be trusted’, Lock the Gate Alliance
New Hope Corporation
New Hope is one of the biggest pure play coal miners on the Australian share market and its proposed New Acland Stage 3 coal mining project is one of Australia’s most contentious.
The $900 million New Acland Stage 3 mine would involve three vast new coal pits dug on the prime agricultural land of Queensland’s Darling Downs. If approved, New Acland Stage 3 is expected to produce 80.4 million ‘product tonnes’ of coal, and extend the mine’s production life by 12 years. If all this coal were combusted, it would release another 174 million tonnes of CO2 into our atmosphere, equivalent to nearly double Australia’s targeted cumulative emissions reduction (2021-2030).
Meanwhile, New Hope is continuing to invest in exploration activities across other coal developments. The coal mining corporation has assessed 231 million tonnes of marketable reserves for its Lenton, Elimatta and Taroom coal tenements.
To justify its business plans, New Hope refers to coal demand scenarios consistent with 3ºC to 6ºC of global warming, and the failure of the Paris Agreement. In July 2021, Market Forces’ lawyers wrote to ASIC, asking the regulator to investigate whether New Hope has misled investors by claiming that coal would “remain a significant part of the energy mix”.
Coal mining spells legal trouble
New Hope’s existing New Acland mine is under investigation by state government regulators after allegedly unlawfully mining $500 million of coal. Previously, New Hope has been fined by the Queensland government for drilling illegal water bores and violating noise conditions at the mine site.
In February 2021, the Oakey Coal Action Alliance (OCAA)—which represents 60 local landholders—won its High Court appeal against New Acland Stage 3. The High Court found original decisions recommending approval of the mine had been the subject of “apprehended bias”. The Court’s decision means a further assessment of New Acland Stage 3 will be conducted by the Land Court. The first Land Court hearing in 2016 took almost 100 sitting days, the longest trial in the Court’s 120 year history.

On behalf of @Market_Forces, @EDOLawyers wrote to @ASICmedia requesting an investigation into New Hope's potentially misleading/deceptive statements.
— Market Forces (@market_forces) July 21, 2021
Make sure @ANZ_AU, @macquariebank & @NAB rule out funding companies expanding #climate-wrecking #coal!https://t.co/yTJ9KKzY25
Santos
Santos’ business plans are wildly inconsistent with the Paris Agreement. While analysis finds meeting the 1.5°C limit means oil and gas production must fall by 4% and 3% respectively annually from 2020 to 2030, Santos plans to increase production by 9% each year over a similar time frame.
These plans include spending US$4.5 billion on oil and gas growth projects over the next five years. In support of these plans, Santos cites a global LNG forecast where (in 2035) demand is 19% above that projected in a 2.7°C warming scenario (the International Energy Agency’s STEPS).
At Santos’ 2021 AGM, shareholders with $1.2 billion of Santos stock voted in favour of a Market Forces-supported resolution calling on the company to wind up oil and gas production assets in line with the Paris Agreement.
Polluting projects
In November 2020, ANZ, NAB, CommBank and Westpac loaned Santos a combined $244 million for the acquisition of oil and gas assets including the Barossa offshore gas field 300 kilometres north of Darwin. Just four months later, Santos made a ‘final investment decision’ to proceed with the Barossa gas project.
Over its lifetime, the Barossa gas project would enable the release of 401 million tonnes of CO2, equivalent to 80% of Australia’s total greenhouse gas emissions in 2020. According to chemical engineer and industrial economist John Robert, the Barossa project is “a carbon-dioxide emissions factory, with an LNG by-product”.
Santos is also pursuing the highly opposed Narrabri Gas Project in NSW, which former Australian Chief Scientist Professor Penny Sackett argues should be blocked on climate grounds, and approval for which has been appealed in the Land and Environment Court of New South Wales.
Narrabri Gas Project risks community and heritage
Aside from climate impacts, expert reviews of the Narrabri Gas Project’s Environmental Impact Statement have identified a variety of potential impacts on Aboriginal cultural heritage, water, and wildlife, as well as economic and social impacts.
Members of the Gomeroi Nation, the Traditional Owners of the Narrabri region, fear the project would destroy sacred sites including the Great Artesian Basin. These concerns, among others, have compelled Traditional Owners and supporters to gather in the hundreds across capital cities to protest the project.
With so many risks involved, it’s no wonder the project is so highly opposed. The NSW Department of Planning and Environment received 23,000 submissions in response to the project’s Environmental Impact Statement, stating ”this is the most submissions the Department has ever received on a development application”. 98% of total and 64% of local submissions opposed the project.
In May 2021 Market Forces supported the North West Alliance, an affiliation of 40 groups across north west NSW, to place a full page message in The Australian Financial Review drawing attention to these impacts and calling on NAB to cease funding companies like Santos.
Santos faces lawsuit
In August 2021, Santos was hit with a lawsuit filed by The Australasian Centre for Corporate Responsibility (ACCR) alleging the company’s statements about gas being “clean” and having a clear pathway to net zero by 2040 were deceptive.
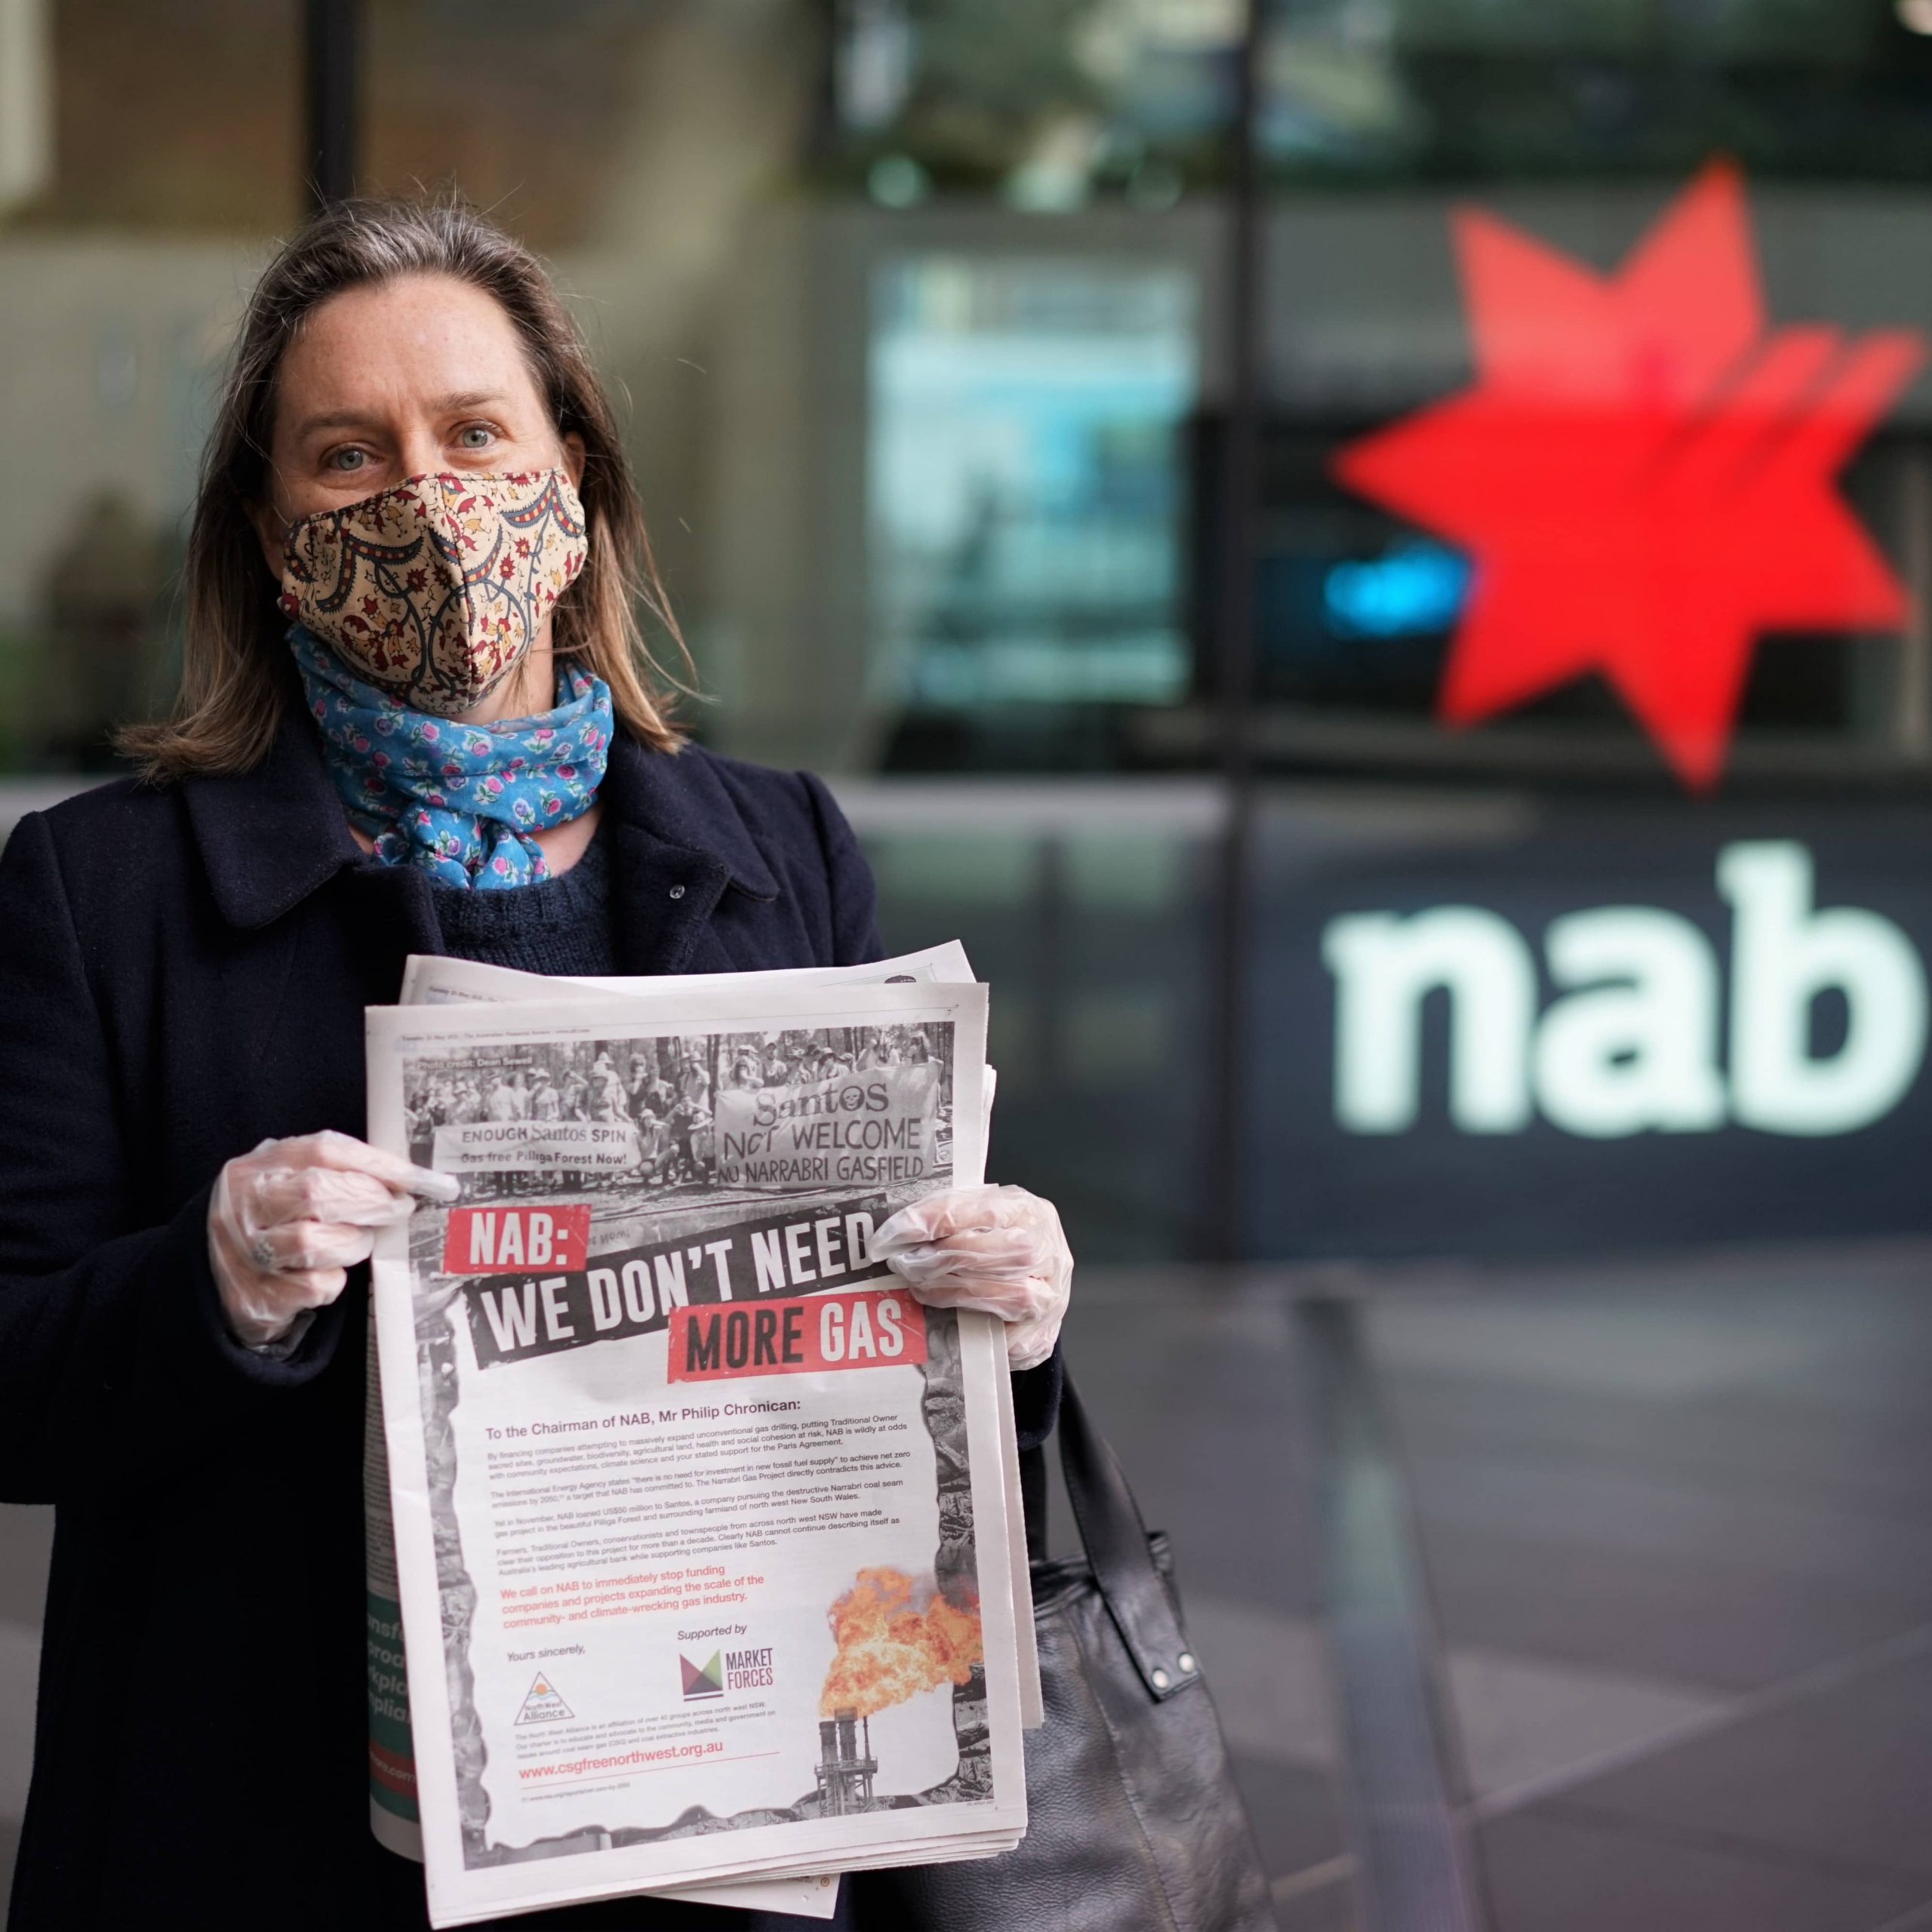
A message to NAB from communities opposing Santos’ Narrabri Gas Project.

“Our Artesian is not up for sale and neither are we.”
Gomeroi people are in Brisbane at the Santos office saying NO to the Narrabri gas project! #frackoffsantos#narrabri pic.twitter.com/pJFSuamIhB
— Lock the Gate (@LockTheGate) December 3, 2020
Woodside
Woodside is Australia’s largest producer of climate-wrecking gas, and its plans to grow this business even further are entirely inconsistent with the 3% annual decline (between 2020 and 2030) in gas production required to limit warming to 1.5°C.
Woodside plans to further increase gas production to 70% above 2019 levels by 2028. Woodside also cites a global LNG forecast showing demand growth of 4% each year to 2035, more than projected in a scenario where global warming increases by 2.7°C.
At Woodside’s 2021 AGM, shareholders with $2.3 billion of Woodside stock voted in favour of a Market Forces-supported resolution calling on the company to wind up oil and gas production assets in line with the Paris Agreement.
Yet this belligerent company remains intent on becoming a fossil fuel behemoth. In August 2021, Woodside announced plans to take over BHP’s entire petroleum business, which would roughly double Woodside’s oil and gas production capacity and make it a global top 10 independent oil and gas company.
Culture- and climate-wrecking projects
In October 2019, ANZ and Westpac loaned Woodside a combined $258 million, which supported its planned expansion of projects including Pluto LNG Train 2 (or ‘Pluto 2’). In the same year, CommBank funded an accommodation facility supporting Woodside’s projects including Pluto LNG.
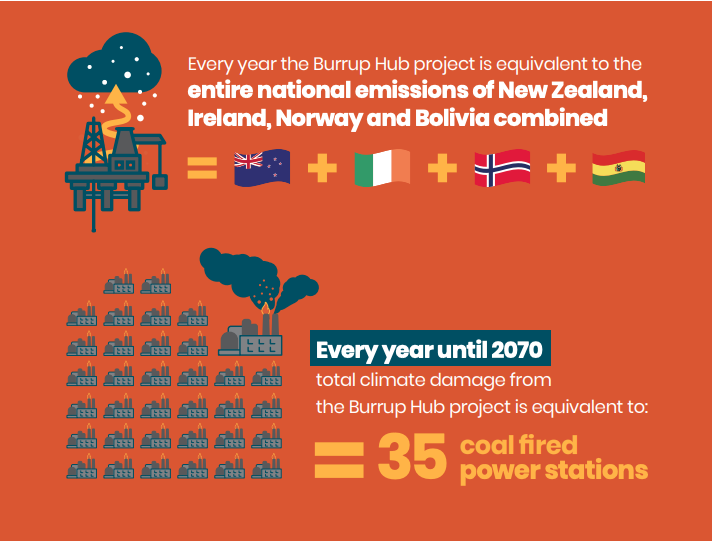
Pluto LNG is part of Woodside’s proposed LNG mega-project known as the ‘Burrup Hub’, which has been labelled one of 12 global ‘carbon bombs’ jeopardising the goals of the Paris Agreement.
Woodside’s Burrup Hub project would result in the emissions equivalent of 15 coal power stations running for 30 years, threaten to accelerate degradation of the Murujuga Rock art (proposed for World Heritage listing) due to industrial emissions, and would also cause significant impacts to the local marine environment.
Legal challenge underway
Legal experts will challenge changes to the approvals for the Burrup Hub in Western Australia’s Supreme Court, arguing “the WA state government unlawfully approved these changes without a full assessment, leaving Australians in the dark about potentially devastating impacts on our climate, communities, coral reefs, and native species”.

“Woodside and Santos are the largest gas company donors to Australia’s major political parties since FY15, donating $1,669,317 and $869,849 respectively, according to analysis by Market Forces” https://t.co/mRdQ7hOAp2
— Market Forces (@market_forces) March 12, 2021
Why did the govt commit to ‘fast track’ their gas projects?🤔
Big banks make a mockery of climate commitments by funding new fossil fuels
The big banks’ continued financing of new fossil fuel projects flouts their climate commitments. Below are some examples of their lending since 2016, just after the Paris Agreement was signed, all of them blatantly inconsistent with 1.5°C and several with the goal of net zero emissions by 2050.
Barossa gas project
In November 2020, ANZ, NAB, CommBank and Westpac loaned Santos a combined $244 million for the acquisition of oil and gas assets including the Barossa offshore gas field 300km north of Darwin. Just four months later, Santos made a ‘final investment decision’ to proceed with the Barossa gas project.
Given the IEA’s finding that net zero by 2050 means “no new oil and gas fields”, the major banks’ funding of projects like Barossa is clearly inconsistent with their commitment to net zero.
The Barossa gas project would produce 3.7 million tonnes of LNG each year for 25 years, during which time it would enable the release of 401 million tonnes of CO2, equivalent to 80% of Australia’s total greenhouse gas emissions in 2020.
Chemical engineer and industrial economist John Robert has labelled the Barossa project “a carbon-dioxide emissions factory, with an LNG by-product”.
In August 2021, Santos was hit with a lawsuit filed by The Australasian Centre for Corporate Responsibility (ACCR) alleging the company’s statements about gas being “clean” and having a clear pathway to net zero by 2040 were deceptive.

Infrastructure at the Darwin LNG facility, where Barossa gas would be processed. Credit: Ken Hodge.
Trailer for ‘Invasion’, a film documenting Traditional Owner resistance to colonial violence and environmental destruction, including the Coastal Gaslink Pipeline funded by NAB.

Activists with 350 Seattle and Protectors of the Salish Sea protest the funding of Coastal GasLink and other fossil fuel projects on 19 Feb 2020. Credit: Sulakshana / RAN.
Coastal Gaslink pipeline
Funded by NAB in May 2020, the 670km Coastal GasLink Pipeline in Canada would transport 2.1 billion cubic feet (bcf) per day of climate-wrecking gas, with the potential to expand to 5 bcf.
Based on conservative estimates, the pipeline would enable the release of 610 million tonnes of CO2 over its lifetime, more than 80% of Canada’s national emissions for the calendar year 2020 (730 Mt CO2-e).
The hereditary chiefs of the Wet’suwet’en Nation, the Traditional Owners of the land on which the pipeline is proposed, fiercely oppose the project and have not provided their free, prior and informed consent. According to the Unist’ot’en, one of 13 hereditary house groups under the Wet’suwet’en Nation:
“Each clan within the Wet’suwet’en Nation has full jurisdiction under their law to control access to their territory. Under ‘Anuc niwh’it’en (Wet’suwet’en law) all five clans of the Wet’suwet’en have unanimously opposed all pipeline proposals and have not provided free, prior, and informed consent to Coastal Gaslink/ TransCanada to do work on Wet’suwet’en lands.”
At its 2020 AGM, NAB was challenged over its funding for the Coastal Gaslink Pipeline despite the lack of Traditional Owner consent. Chairman Philip Chronican shamefully admitted the bank is “not necessarily privy to” issues facing the projects it funds, implying NAB doesn’t fully assess the environmental, social and governance risks of its investments.
Cambo oil field
CommBank has funded Siccar Point Energy, the company behind the proposed Cambo Oil Field, situated north-west of the Shetland Islands offshore UK, on numerous occasions since at least 2016. In 2018, Siccar stated the lending positioned it “extremely well” to deliver projects including Cambo, and made a similar statement when CommBank further extended that loan in 2020.
The first phase of Cambo targets 170 million barrels of oil from 2025 until 2050, well beyond the point when the IEA concludes all new oil fields must be abandoned to achieve net zero by 2050.
The first phase oil from Cambo is sufficient to enable the release of 65 million tonnes of CO2, 30% more than was emitted from all UK-based power stations in 2020. Further phases of production planned beyond the first, with Siccar stating “the field contains over 800 million barrels of oil in place”.
Greenpeace has proceeded with legal action against the UK Government, in Scotland’s highest civil court, calling for key decisions regarding Cambo to be overturned and for the revocation of drilling permits.

Rally after the occupation of a UK Government building in Edinburgh to protest the proposed Cambo oil field. Credit: Jessica Kleczka.
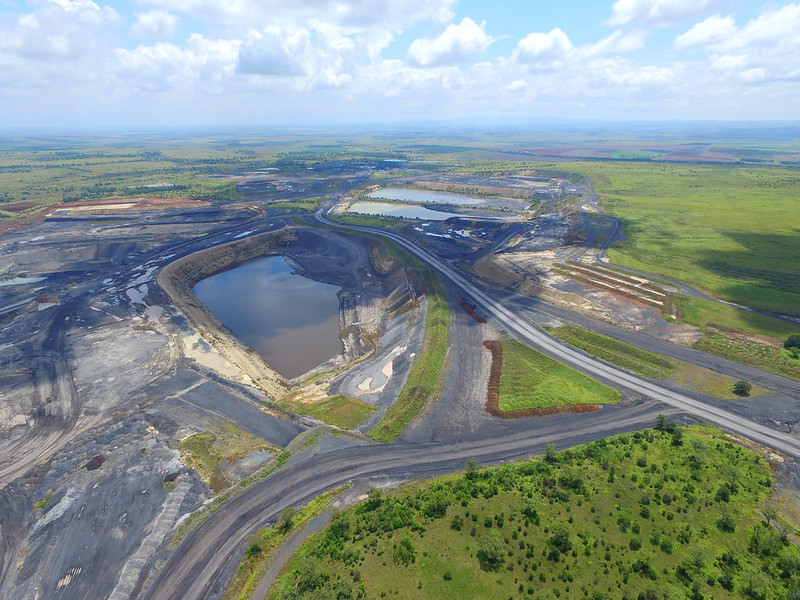
New Acland coal mine, south-east Queensland. Credit: Lock the Gate Alliance (CC BY 2.0)
New Acland Stage 3 coal mine
In December 2018, ANZ and NAB were among lenders that provided $600 million to New Hope for purposes including the proposed New Acland Stage 3 coal mine on prime agricultural land in Queensland’s Darling Downs. The deal was shrouded in secrecy, as New Hope’s CEO declined to publicly identify the lenders.
This project involves three new mine pits which New Hope expects would produce 80.4 million ‘product tonnes’ of coal. The project directly contradicts the IEA’s conclusion that net zero by 2050 means “no new coal mines or mine extensions”.
In February 2021, the Oakey Coal Action Alliance (OCAA) representing 60 landholders, won a High Court challenge resulting in New Acland Stage 3 being knocked back for a fresh hearing by Queensland’s Land Court. The first Land Court hearing in 2016 took almost 100 sitting days, the longest trial in the Court’s 120 year history.
It’s unclear how NAB squares its funding for New Acland Stage 3 with its commitment to no longer finance new thermal coal mines or extensions.
Pluto 2 (part of the ‘Burrup Hub’)
In 2019 ANZ and Westpac each made loans supporting Pluto LNG train 2 (Pluto 2), a project being pursued by Australia’s largest oil & gas company Woodside Energy. In the same year, CommBank funded an accommodation facility supporting Woodside’s LNG projects including Pluto.
This gas processing facility would liquefy up to 5 million tonnes of gas each year for export overseas, despite the IEA’s conclusion that net zero emissions by 2050 means “many of the liquefied natural gas (LNG) liquefaction facilities currently under construction or at the planning stage” are “not needed”.
Pluto LNG is part of Woodside’s proposed LNG mega-project known as the ‘Burrup Hub’, which has been labelled one of 12 global ‘carbon bombs’ jeopardising the goals of the Paris Agreement.
Woodside’s Burrup Hub project would result in the emissions equivalent of 15 coal power stations running for 30 years, threaten to accelerate degradation of the Murujuga Rock art (proposed for World Heritage listing) due to industrial emissions, and would also cause significant impacts to the local marine environment.
Legal experts will challenge changes to the approvals for the Burrup Hub in Western Australia’s Supreme Court, arguing “the WA state government unlawfully approved these changes without a full assessment, leaving Australians in the dark about potentially devastating impacts on our climate, communities, coral reefs, and native species”.
Credit: Clean Slate & CCWA

Coal seam gas wells in Queensland. The Tipton West Central Gas Processing Facility processes coal seam methane from Queensland’s Surat Basin. Credit: Lock the Gate.
Tipton West Gas Central Processing Facility expansion
In March 2020, ANZ, NAB and CommBank funded the expansion of the Tipton West Gas Processing Facility near Dalby, Queensland.
The expansion of the facility is expected to more than double its original capacity to process 33 terajoules (TJ) of coal seam gas each day from Queensland’s Surat basin, adding capacity of between 48-81 TJ per day.
The expansion caters for Arrow Energy’s planned drilling of new gas wells in the region, with the company’s former CEO Qian Mingyang stating this is “expected to involve 90 new wells in the initial phase and another 180 wells over the next 25 years”.
Arrow’s Tipton expansion is part of the company’s much larger Surat Gas Project, which the company sanctioned on 17 April 2020. According to the Company, “over the full 27 year life of the Surat Gas Project, Arrow expects to develop around 5 TCF [trillion cubic feet] of natural gas”.
5 TCF of gas would enable the release of 286 million tonnes of CO2, equivalent to more than half of Australia’s greenhouse gas emissions in 2020.
US LNG projects
CommBank and NAB have funded LNG projects in Texas to the tune of $1.1 billion, comprising the Sabine Pass, Corpus Christi and Freeport projects. Combined, these projects would have the capacity to liquefy 63.5 million tonnes of LNG each year, rivalling Australia’s 87.8 million tonne capacity (Australia was the world’s largest exporter of LNG in 2020).
These facilities, all located near the coast, face significant risks from sea-level rise and flooding as climate change worsens. Since at least 2018, the US oil & gas industry has lobbied government to defend its assets in Texas from climate risks by seeking US$12 billion for a ‘coastal spine’ of concrete seawalls, earthen barriers, floating gates and steel levees on the Texas Gulf Coast. In February 2020, engineers were appointed to design the US$1.9 billion ‘Orange’ project intended to protect infrastructure at Sabine Pass and Freeport.
“Also not needed are many of the liquefied natural gas (LNG) liquefaction facilities currently under construction or at the planning stage.”
– ‘Net Zero by 2050’, International Energy Agency (IEA), May 2021
Climate impact of new fossil fuels
From 1 Jan 2016 to 31 Dec 2020, the big four banks loaned $7.8 billion to expansionary fossil fuel projects via 64 separate finance deals. For 50 of these deals involving big four banks lending $6.5 billion, Market Forces identified the specific fossil fuel projects funded and the resulting CO2 emissions enabled by those projects.
| wdt_ID | Project name | Location | Big four banks involved | Lifetime CO2 emissions enabled |
|---|---|---|---|---|
| 1 | Sabine Pass LNG Terminal | USA | CBA, NAB (Train 6) | 1,635 |
| 2 | Ichthys LNG | Australia | ANZ, WBC | 1,131 |
| 3 | Permian Highway Pipeline | USA | CBA | 1,018 |
| 4 | Johan Sverdrup offshore oil field | Norway | ANZ, CBA | 966 |
| 5 | Corpus Christi LNG | USA | CBA, NAB | 775 |
| 6 | Midship Pipeline | USA | CBA, NAB | 698 |
| 7 | Coastal Gaslink pipeline | Canada | NAB | 610 |
| 8 | Refinery and Petrochemical Integrated Development (RAPID) Complex | Malaysia | ANZ | 583 |
| 9 | Barossa gas project | Australia | ANZ, CBA, NAB, WBC | 401 |
| 10 | Elk-Antelope gas fields | PNG | ANZ, WBC | 342 |
The big four banks have provided finance for 37 new or expanded fossil fuel projects since committing to support the Paris Agreement. Over their lifetimes, these projects are expected to enable the release of an additional 10 billion tonnes of CO2. This is enough to cancel out any gains made under Australia’s emissions reduction target (2021-2030) 114 times over.
The images below illustrate the total estimated lifetime emissions enabled by expansionary fossil fuel projects that the big banks financed from 1 Jan 2016 until the end of 2020.
CommBank and ANZ are clearly the worst, each lending to projects that would enable emissions equivalent to 9+ years of Australia’s total greenhouse gas emissions in 2020.
Although each of the banks reduced funding for expansionary fossil fuel projects in 2020, as shown by the chart below, all of them still provided funding for huge ‘carbon bomb’ projects such as the Barossa Gas Project and failed to rule out this type of funding moving forward.
Total lifetime emissions of new or expanded projects financed by each bank since 1 Jan 2016


Lending to new or expanded fossil fuel projects since Jan 2016

Fossil fuel lending too high, renewables lending too low
The big four banks often point to renewable energy lending as a defence when challenged over their colossal financing of fossil fuels. But lending to renewables does not excuse or cancel out funding for dirty alternatives. Every dollar to fossil fuels locks in more harmful emissions, for which there is no room for in a Paris- or net zero-aligned economy.
Despite their Paris Agreement commitments, the big four have loaned nearly THREE times as much to fossil fuels as renewable energy since 2016. Renewables counted for just $14.9 billion of their total lending compared with $44.4 billion for fossil fuels.
ANZ continues to have by far the worst lending ratio of the big four, providing $6.20 to fossil fuels for every dollar loaned to renewable energy. CommBank’s lending ratio of $3.63 : $1.00, while much lower, is still completely inconsistent with its promise of “playing our part in limiting climate change in line with the goals of the Paris Agreement”. Westpac has loaned $2.93 to fossil fuels for every dollar loaned to renewables since 2016. And while NAB’s fossil fuels to renewables ratio was the best of the big four banks, it still favoured dirty power sources. What’s worse, its ratio—like ANZ and Westpac’s—has tipped further towards fossil fuels since we last conducted this comparison 12 months ago.

Fossil fuel : Renewables lending ratio (1 Jan 2016 – 31 Dec 2020)
Policy laggards
Out of step with top legal opinion?
The failure of Australia’s major banks to align their climate policies with their stated support for net zero emissions by 2050 could land them in legal trouble, based on a recent legal opinion about the pitfalls of corporate greenwash.
According to barristers Noel Hutley SC and Sebastian Hartford Davis, “companies wishing to commit to net zero must have a reasonable basis now for believing that they can achieve that commitment”, and that “it is foreseeable that a company (and its directors) could be found to have engaged in misleading or deceptive conduct by not having had reasonable grounds”.
Lagging behind peers
Australia’s big four banks fall well behind their international peers when it comes to climate policies.
In the 2021 Banking on Climate Chaos Fossil Fuel Finance Report, the best performing Australian bank is ANZ, scoring a measly 22.5 out of 200 possible points. The study assesses bank policies and practices related to certain key fossil fuel subsectors.
While it’s worth acknowledging that some of the big banks’ policies have improved in recent years, it’s hard to applaud a scorecard dominated by such low scores.
Learn more about each bank’s policies below:
ANZ
ANZ’s climate policy was updated in October 2020, long after its major competitors had significantly updated their climate policies, starting with CommBank in August 2019. While some positive steps were taken, it also contained cynical elements and barely caught it up to the other banks. In many ways it was a wasted opportunity.
By far the most cynical aspect of its policy is ANZ’s rewarding of companies expanding the fossil fuel industry. Despite being published five years after the Paris Climate Agreement, the bank’s policies give the most climate-destructive companies—including New Hope—until 2025 to formulate transition plans.
Following in the footsteps of Commonwealth Bank and Westpac, ANZ announced it will exit direct finance for thermal coal by 2030, consistent with the climate goals of the Paris Agreement.
The bank also pledged to stop funding new mines with thermal coal reserves or production of 35%+ (though left the door open to funding projects below this threshold), and new coal power stations or expansions. This barely exceeds, if at all, its major competitors, most of which have policies that effectively achieve the same thing.
ANZ’s policies don’t even touch oil and gas, leaving the door wide open for the bank to increase its overall lending to the sector, and to fund companies and projects expanding its scale.
CommBank
Two years after becoming the first Australian bank to commit to exit thermal coal by 2030, among other positive steps, CommBank’s August 2021 climate policy update saw the bank wind back existing policy, make immaterial commitments and give a free pass to climate-wrecking companies. It was clearly a step in the wrong direction.
In 2019, the bank committed to exclude funding for new oil, gas and metallurgical coal projects unless supported by an assessment demonstrating them consistent with the Paris Agreement. CommBank has now wound back the scope of this policy to apply only to a specific type of financial arrangement (‘project finance’) and only to extractive fossil fuel projects (rather than pipelines and power stations, for example). In other words, instead of being shut further, the door has been opened to fund even more expansionary fossil fuel projects.
CommBank’s adherence to the previous (2019) version of this policy is now the subject of a legal case, with a shareholder seeking access to the documents upon which the bank based its funding for expansionary oil and gas projects.
The bank also set trajectories (‘glidepaths’) for its fossil fuel financing and financed emissions for the coal, oil and gas sectors moving forward. The glidepaths are set to track the IEA’s Sustainable Development Scenario (SDS), a global energy demand pathway aligned with net zero emissions by 2070 and which allows for expansion of the fossil fuel industry. This is clearly out of step with the bank’s support for net zero by 2050.
CommBank also made a number of commitments that sound good, but have little or no material impact:
– Its exclusion of new or expanded thermal coal mines and new coal power stations was effectively already covered by its standing commitment to exit thermal coal by 2030, and
– Its decision to only fund new fossil fuel clients with public commitments to the Paris Agreement is largely meaningless, given it already has more such clients than it can poke a stick at, and such public commitments are ineffective without a requirement for short-, medium- and long-term targets to align with the Paris Agreement.
What’s worse was CommBank’s decision to continue funding its existing climate-wrecking fossil fuel clients—including Santos—until 2025 before “expecting” publication of a Paris-aligned transition plan. Even then, this is an expectation rather than a requirement, there’s no requirement for clients to adopt the plans (merely to publish), and there’s no requirement for short-, medium- and long-term targets to achieve those plans.
NAB
In November 2019 NAB committed to be out of thermal coal by 2035, five years later than all of its major competitors, and also five years later than when OECD countries have been told we need to phase out coal-fired power completely. In some ways, this is worse than having no policy at all, as it deliberately aims for the failure of the Paris Agreement.
Since then the bank has failed to align its policies with its support for net zero by 2050 or the Paris Agreement, leaving the door wide open to increase its overall lending to fossil fuels, and to fund companies and projects expanding the fossil fuel industry.
NAB has a standing policy to no longer finance new-to-bank thermal coal mining customers, and new or material expansions of coal-fired power generation facilities, unless there is technology in place to materially reduce emissions. NAB fails to clarify what it considers “material”, implying a lot of wriggle room to justify further lending for coal plants.
It is also committed to not financing oil/tar sands extraction projects, or oil and gas projects within or impacting the Arctic National Wildlife Refuge area and any similar Antarctic Refuge. This is materially meaningless given there is no record of NAB having made such loans in the first place and that NAB had confirmed to Market Forces prior to the policy announcement it was not invested in Arctic oil and gas in the first place.
While each of these sound good on the surface, most have no material impact on the bank’s lending activity in the first place. Then there’s the policy NAB has been breaching.
In 2017, NAB said it will stop funding new thermal coal mining projects. Since then, NAB has funded New Hope Corp (for its New Acland Stage 3 coal mine), Coronado Global Resources (owner of the Curragh coal mine, which has planned or undergone extensions and expansions) and Whitehaven Coal (which is pursuing new thermal coal mining projects). Given the bank’s lack of adherence to the ‘policy’ and its lack of accountability, it’s clear the bank has effectively rescinded it.
Westpac
Westpac’s climate change policy update, released in May 2020, committed to a 2030 exit date for thermal coal exposure.
The update saw Westpac commit to continue reducing the emissions intensity of its power generation portfolio, targeting 0.23 tonnes of CO2 per Megawatt-hour (tCO2e/MWh) by 2025 and 0.18 tCO2e/MWh by 2030. This effectively squeezes out new coal-burning power stations and makes it almost impossible to finance new gas-fired power plants.
These commitments build upon Westpac’s existing policies to refuse loans for thermal coal mines in new thermal coal basins or with a calorific content of less than 6,300 kcal/kg, and to only finance new power stations if they decrease the emissions intensity of the grid in which they operate.
In May 2021 Westpac stated that, to be eligible for loans, it “expects” new oil and gas clients “to have publicly disclosed Paris-aligned business goals”. Given this is an expectation rather than a requirement, and that Westpac already has more existing oil and gas clients than it can poke a stick at (let alone new ones), this policy will have no material impact on the bank’s lending.
Far too much room remains for Westpac to increase its overall lending to fossil fuels, and to fund companies and projects that depend upon the failure of the Paris Agreement.
Banks breaching their own policies?
Commbank
In 2019 CommBank announced it would be “only providing Banking and Financing activity to New oil, gas or metallurgical coal projects if supported by an assessment of the environmental, social and economic impacts of such activity, and if in line with the goals of the Paris Agreement”.
Prior to winding back this policy in August 2021, CommBank funded a number of expansionary oil and gas projects which appear inconsistent with the Paris Agreement, prompting shareholders to question the existence and validity of the assessments demonstrating the projects to be Paris-aligned.
CommBank’s unwillingness to provide these assessments has landed it in court, with Professor Jacqueline Peel warning “If you get the information and it shows that there’s a difference between what they say they’re doing and what they’re actually doing, that potentially would be grounds for a case for breaching directors’ duties or misleading and deceptive conduct, or both”.
Some of the expansionary oil and gas projects funded by CommBank include:
Permian Highway Pipeline
In Sep 2019, CommBank loaned US$52.25 million for development and construction of a 692 km gas pipeline that would transport gas from the Permian basin in southwestern United States to the Texas Gulf Coast. Market Forces conservatively estimates combustion of gas transported over the pipeline’s lifetime would enable the release of approximately 1 billion tonnes of CO2.
Cambo Oil Field
CommBank has funded Siccar Point Energy, the company behind the proposed Cambo Oil Field, situated north-west of the Shetland Islands offshore UK, on numerous occasions since at least 2016. In 2018, Siccar stated the lending positioned it “extremely well” to deliver projects including Cambo, and made a similar statement when CommBank further extended that loan in 2020.
The first phase of Cambo targets 170 million barrels of oil from 2025 until 2050, well beyond the point when the IEA concludes all new oil fields must be abandoned to achieve net zero by 2050.
The first phase oil from Cambo is sufficient to enable the release of 65 million tonnes of CO2, 30% more than was emitted from all UK-based power stations in 2020. Further phases of production planned beyond the first, with Siccar stating “the field contains over 800 million barrels of oil in place”.
7 new LNG vessels
In Dec 2019, CommBank was reported as having acted as ‘lead arranger’ in a US$1.05 billion debt financing of GasLog Ltd for the building of seven new LNG vessels.
Tipton West Gas Central Processing Facility expansion
In March 2020, CommBank funded the expansion of the Tipton West Central Gas Processing Facility near Dalby, Queensland.
The expansion of the facility is expected to more than double its original capacity to process 33 terajoules (TJ) of coal seam gas each day from Queensland’s Surat basin, adding capacity of between 48-81 TJ per day.
The expansion caters for Arrow Energy’s planned drilling of new gas wells in the region, with the company’s former CEO Qian Mingyang stating this is “expected to involve 90 new wells in the initial phase and another 180 wells over the next 25 years”.
Arrow’s Tipton expansion is part of the company’s much larger Surat Gas Project, which the company sanctioned on 17 April 2020. According to the Company, “over the full 27 year life of the Surat Gas Project, Arrow expects to develop around 5 TCF [trillion cubic feet] of natural gas”.
5 TCF of gas would enable the release of 286 million tonnes of CO2, equivalent to more than half of Australia’s greenhouse gas emissions in 2020.
NAB
On 14 December 2017, NAB ruled out lending to all new thermal coal mines or extensions, stating “NAB will no longer finance new thermal coal mining projects”.
NAB appears to have breached this policy on a number of occasions since then, as detailed below, and has refused any form of accountability for its actions.
Speaking at the bank’s 2020 AGM, the bank’s chairman Philip Chronican told shareholders simply “there is no breach that I’m aware of”. NAB also dodged questions about the apparent breaches from a member of the Australian Parliament, who told NAB its reply “didn’t answer the question directly” and repeated them.
NAB appears to have breached its thermal coal exclusion policy by making the following loans:
New Hope Corporation (New Acland Stage 3 thermal coal mine)
According to an article published via Bloomberg Professional on 15 Jan 2019, “ANZ, CAT Finance, NAB, Macquarie, Mizuho are providing New Hope with a facility to fund its acquisition of a stake in Bengalla Joint Venture”.
The loan referred to was $600 million for the acquisition of the Bengalla coal mine but which New Hope also stated “will be sufficient for the Company to also fund its medium term growth projects including New Acland Stage 3”.
Coronado Global Resources (Curragh coal mine extension and expansion)
In October 2018, NAB co-financed a $720 million underwriting debt facility backing the initial public offering (IPO) of Coronado Global Resources on the Australian Securities Exchange (ASX).
Coronado had acquired the Stanwell Reserve Area (a coal mining area) in August 2018, which it states ‘unlocked access’ to 318 Mt of coal resources including 82 Mt of reserves at the Curragh coal mine and “extend[s] mine life beyond 35 years”. This was part of a deal with the owners of Queensland’s Stanwell coal-fired power station, whereby Coronado agreed to supply Stanwell with coal from 2027 until 2038, while “Stanwell will receive $210 million (plus interest) in exchange for its rights to coal resources at the Curragh Mine”, according to the Queensland Audit Office.
Crucially, as part of an investor presentation published on the ASX in October 2018, Coronado stated the Stanwell agreement was “expected to materially extend mine life until around 2038”, well beyond the investor-backed 2030 deadline for OECD countries to phase out coal power. Surely NAB’s coal policy should have prevented it supporting the IPO of a company which planned to materially extend thermal coal mining?
Far from pulling out of the deal, NAB recommitted to and bolstered funding for Coronado. In September 2019, NAB loaned to Coronado Global Resources to refinance the October 2018 loan and provide it with additional funds to expand its Curragh coal mine. According to Coronado’s 2019 Half Year Results Presentation, “the expansion is set to deliver an additional 6.0 Mt from FY20 to FY23”. NAB clearly needs to explain how its funding for Coronado complies (or doesn’t) with its coal policy.
Methodology
Scope
- Lenders: ANZ, CommBank, NAB and Westpac
- Assets: Fossil fuel companies and projects globally
- Timeframe: 1 Jan 2016 – 31 Dec 2020
- Finance type: Project and corporate loans
- Transaction type: Primary, refinancing, acquisition
Market Forces obtained primary data from finance industry databases provided by IJGlobal and Refinitiv. Further primary data was sourced from company filings, reports and market disclosures. Figures were cross-referenced for consistency and verified against secondary material. This report presents a synthesis of this material.
The loans we have captured include refinancings, as (1) we consider each refinancing a conscious decision by a lender to continue supporting a company or project, and (2) the lending group can and often does change upon refinancing and we wanted to capture this.
Where corporate lending occurred, we sought direction on the purposes of the loan and if this was not available, discounted the value of that loan to reflect the proportion of the company’s business that is involved in the fossil fuel supply chain.
Dollar values represent the sum of committed loan amounts and are presented in Australian dollars unless otherwise specified. No adjustments have been made to reflect the net present value of facilities arranged before 1 Jan 2021.
We have tried to capture as much information as possible in this study but a lack of transparency about fossil fuel lending means it will only ever be a partial picture.
Calculations and assumptions - climate impact of new fossil fuel projects
To return to the “Climate impact of new fossil fuels” section above, click here.
Calculations and assumptions
In calculating the emissions accounted for in this study, Market Forces has made a number of conservative assumptions. Details on how the emissions were calculated are as follows:
Coal mines
Energy and emission factors are derived from the Australian Department of Industry NGER Technical Guidelines 2017-18 unless stated otherwise. Although mines often produce a mix of thermal and metallurgical coal, our calculations are based on the main product (thermal or coking coal) for each project unless specified otherwise. This approach was taken to ensure calculations are as straightforward as possible and resulted in no material difference in the magnitude of the emissions estimates.
New Acland Stage 3 project
The New Acland Stage 3 2014 environmental impact assessment (EIS) states “The revised Project involves the extension of the Mine’s operating life to approximately 2029 with the inclusion and progressive development of two new resource areas within MLA 50232. These resource areas are identified as the Manning Vale and Willeroo resource areas. The revised Project will include mining in three new mine pits, namely Manning Vale West, Manning Vale East and Willeroo mine pits.” (p.3-1) The same document states there are a combined 80.4 million ‘product tonnes’ of coal at the Manning Vale West, Manning Vale East and Willeroo mine pits (table 3-4). So 80.4 million tonnes of coal x 1,000,000 (million tonnes of coal to tonnes of coal) x 24 GJ/t (average energy factor for sub-bituminous and bituminous coal) x 90.23 kg CO2-e/GJ (average emissions factor for sub-bituminous and bituminous coal) x 0.001 (kg of CO2 to tonnes of CO2) = 174 million tonnes of CO2.
Curragh coal mine expansion
In September 2019, Coronado Global Resources secured finance to expand its Curragh coal mine in central Queensland. According to Coronado’s 2019 Half Year Results Presentation, “the expansion is set to deliver an additional 6.0 Mt from FY20 to FY23”. This is to be achieved by incrementally increasing annual production by 2.1 Mt (from 12.9 Mt to 15 Mt) between FY19 to FY23. According to the same presentation, the Curragh mine had 311 Mt of reserves as of 31 December 2018. Assuming that the 2.1 Mt of additional coal is mined beyond FY23, until Curragh’s 311 Mt of reserves are depleted, this would result in approximately 39.6 Mt of additional coal mined by 2039.
This expansion comes after Coronado acquired the Stanwell Reserve Area (SRA) in August 2018, which it states ‘unlocked access’ to 318 Mt of resources including 82 Mt of reserves and “extend[s] mine life beyond 35 years”. This was part of a deal with the owners of Queensland’s Stanwell coal-fired power station, whereby Coronado agreed to supply Stanwell with coal from 2027 until 2038, while “Stanwell will receive $210 million (plus interest) in exchange for its rights to coal resources at the Curragh Mine”, according to the Queensland Audit Office.
Discounting the Stanwell arrangements and assuming that an additional 2.1 mtpa is mined until the mine’s reserves are exhausted, we estimate the expansion would result in an additional 39.6 Mt of coal mined. Estimated emissions calculation: 39.6 million tonnes of coal x 1,000,000 (million tonnes of coal to tonnes of coal) x 30 GJ/t (coking coal) x 92.02 kg CO2-e/GJ (emissions factor for coking coal) x 0.001 (kg of CO2 to tonnes of CO2) = 109 million tonnes of CO2.
Carborough Downs coal mine expansion
Fitzroy Resources secured finance in 2018 and 2019 for its Carborough Downs coal mine in Queensland, which it claims to have expanded since it acquired the mine in 2017. There is limited public information relating to the reserves and expansion of the mine, however we know Carborough Downs had 33 Mt of coal reserves according to a project brief published by Fitzroy Resources prior to Q1 2018. According to Mining Monthly, Carborough Downs saw a “100% increase in JORC reserves in the first year under Fitzroy ownership” based on. Therefore, it was assumed that Fitzroy doubled reserves from 16.5 Mt to 33 Mt since acquiring the mine. This appears consistent with a statement made by Fitzroy’s CEO Grant Polwarth. According to the same Mining Monthly article from June 2018, Polwarth said “we have now mined in excess of 2 million tonnes of resource that was never previously contemplated while opening up the northern reserves and creating a 10 plus year future”. Given that Fitzroy acquired the mine in June 2017, it appears the company took approximately 1 year to mine the 2 million tonnes of coal that was “never previously contemplated”. Assuming this is the case, if Fitzroy were to mine 2 Mt over 10 years, it would extract 20 Mt of coal that was “never previously contemplated”. Estimated emissions calculation: 16.5 million tonnes of coal x 1,000,000 (million tonnes of coal to tonnes of coal) x 30 GJ/t (coking coal) x 92.02 kg CO2-e/GJ (emissions factor for coking coal) x 0.001 (kg of CO2 to tonnes of CO2) = 45.5 million tonnes of CO2.
Downstream oil & gas infrastructure
Refinery and Petrochemical Integrated Development (RAPID) project
According to project documents RAPID would have capacity to produce the following volume of refined oil products (figures in thousands of barrels per day, or ‘kbd’): 65.7 kbd of motor gasoline + 92.7 kbd of diesel + 20.4 kbd of jet fuel + 27.3 kbd of fuel oil. In the absence of more detailed information, it was assumed that the project would operate at 75% capacity for 25 years (according to The Institute of Chartered Accountants of India, the useful life of refinery processing units is 25 years, which appears consistent with figures from the Australian Tax Office relating to the useful life of petroleum refining assets). These volumes were then multiplied by the US EPA emissions factors for each fuel type (kg CO2 / barrel): 368.75 for motor gasoline, 428.81 for diesel, 409.49 for jet fuel, 473.33 for fuel oil.
The full calculation is as follows:
- Motor gasoline: 65.7 kbd of motor gasoline x 368.75 kg CO2 / barrel of motor gasoline x 365 days per year x 25 years x 75% capacity factor = 165,803,856 kg CO2
- Diesel: 92.7 kbd of diesel x 428.81 kg CO2 / barrel of diesel x 365 days per year x 25 years x 75% capacity factor = 272,044,667 kg CO2
- Jet fuel: 20.4 kbd of jet fuel x 409.49 kg CO2 / barrel of jet fuel x 365 days per year x 25 years x 75% capacity factor = 57,170,175 kg CO2
- Fuel oil: 27.3 kbd of fuel oil x 473.33 kg CO2 / barrel of fuel oil x 365 days per year x 25 years x 75% capacity factor = 88,434,414 kg CO2
Total emissions enabled: 583 million tonnes of CO2.
Tipton West Central Gas Processing Facility expansion
According to IJGlobal, on 31 March 2020 Energy Infrastructure Investments (EII) received a A$230 million term loan “for the development of an expansion to the Tipton West Gas Processing Facility”.
According to Arrow Energy, “the Tipton central gas processing facility (CGPF) processes up to 33 TJ/d; potentially increasing by 48 TJ/d to 81/day after the Tipton expansion”. Therefore, the expansion is the additional processing capacity of 48 TJ/d (terajoules per day) of gas.
Most infrastructure operates below its maximum capacity. However, in this case, Arrow Energy stated in 2017 that it embarked on a ‘$100M+ Produce the Limit (PtL) project’ to “enable Arrow to run existing compression facilities to their maximum design limits”. Therefore, it’s assumed the facility will process an entire additional 48 TJ/day of gas.
The expected life of the processing facility is unclear, though an APA Group 2006 media release provides a clue. The release, which announced the agreement to build the Tipton West Gas Processing Facility, states “the facility will operate for 15 years”. So in the absence of further information, it was assumed the 48 TJ/d expansion would operate for 15 years.
This means the facility would process 48 x 365 x 15 = 262,800 TJ of gas per year, equivalent to 262.8 million gigajoules (GJ). Upon combustion, 1 GJ of LNG releases 51.53 kg CO2-e (‘National Greenhouse Accounts Factors’, Australian Government Department of Industry, Science, Energy and Resources, 2020). Therefore, combustion of the gas processed at Tipton West would result in emissions of approximately 262,800,000 x 51.53 kg CO2-e = 13.5 million tonnes of CO2.
This expansion in gas processing capacity would cater for Arrow Energy’s planned drilling of new gas wells in Tipton, Queensland, with Arrow Energy CEO Qian Mingyang stating “The planned expansion of Arrow’s Tipton operations is expected to involve 90 new wells in the initial phase and another 180 wells over the next 25 years – along with new gathering lines, an upgraded water treatment facility and four new compressors”.
The Tipton West expansion is part of Arrow Energy’s much larger Surat Gas project, which the company sanctioned on 17 April 2020. According to the Company, “Over the full 27 year life of the Surat Gas Project, Arrow expects to develop around 5 TCF of natural gas”.
5 trillion cubic feet (TCF) of gas is equivalent to 141.6 billion cubic metres (bcm) of gas (UK Government greenhouse gas conversion factors). Using combustion factors provided by the National Greenhouse Accounts Factors (Australian Department of Industry, 2020), upon combustion this volume of gas would release 286 million tonnes of CO2.
Oil & gas pipelines
Unless stated otherwise, it was assumed that the:
– lifespan for US-based pipelines is 50 years based (according to a U.S. Department of Energy laboratory; “a natural gas pipeline generally has a design life of more than 50 years, although the actual life may be considerably longer”).
– lifespan for Australia-based pipelines is 40 years (according to an article published in the Journal of the Australian Petroleum Production & Exploration Association (APPEA), “so many pipeline assets around Australia are approaching operating lives of 40-50 years”).
– capacity factor for pipelines is 50% (according to Matteo Villa, Research Fellow at the International Society for Performance Improvement, “as a rule of thumb it is generally assumed that, in order to guarantee sufficient return on investment to project participants, a pipeline requires a utilization rate of around 50%”).
Permian Highway Pipeline
Kinder Morgan reports the pipeline is designed to transport up to 2.1 billion cubic feet per day (bcfpd) of gas. Therefore, the emissions enabled by this project are estimated to be: 2.1 billion cubic feet per day x 365 days in a year x 50 years x 50% (assumed capacity factor) x 1,000,000 (conversion from bcfpd to thousand cubic feet per day) x 53.120 kg CO2-e per thousand cubic feet natural gas (US EIA emissions factor) * 0.001 (kg of CO2 to tonnes of CO2) = 1.01 billion tonnes of CO2.
Midship Pipeline
The Midship Pipeline in Oklahoma has capacity to transport 1,440,000 Dekatherms of gas per day. Therefore, the emissions enabled by this project are estimated to be: 1,440,000 Dekatherms per day x 1.0 (Dekatherms to million british thermal units per day) x 1.0 (million british thermal units to thousand cubic feet per day) x 365 days per year x 50 years x 50% (assumed capacity factor) x 53.120 kg CO2-e per thousand cubic feet natural gas (US EIA emissions factor) * 0.001 (kg of CO2 to tonnes of CO2) = 698 million tonnes of CO2.
Tanami Gas Pipeline
Tanami Gas Pipeline’s owners, Australian Gas Infrastructure Group, reports the pipeline will have capacity to transport 13 TJ of natural gas per day. Therefore, the emissions enabled by this project are estimated to be: 13 TJ per day x 365 days in a year x 40 years x 50% (assumed capacity factor) x 51.8 kg CO2-e per GJ of natural gas combusted (NGER Technical Guidelines 2017-18) x 0.001 (kg of CO2 to tonnes of CO2) = 4.9 million tonnes of CO2.
Coastal Gaslink pipeline (670 km)
The British Columbia Environmental Assessment Office reports the pipeline “would have a capacity of 2.1 billion cubic feet (bcf)/day with the potential for expansion up to approximately 5 bcf/day with up to 8 compressor stations”.
The project’s Assessment Report states the project’s lifetime is “30+ years”.
Therefore, the emissions enabled by this project are estimated to be: 2.1 billion cubic feet per day x 365 days in a year x 30 years x 50% (assumed capacity factor) x 1,000,000 (conversion from bcfpd to thousand cubic feet per day) x 53.12 kg CO2 per thousand cubic feet natural gas (US EIA emissions factor) * 0.001 (kg of CO2 to tonnes of CO2) = 610 million tonnes of CO2.
LNG terminals
Assumed a 75% average capacity factor across a 30-year economic lifetime for LNG trains and terminals, unless stated otherwise.
Corpus Christi LNG
According to Cheniere Energy, the owner of Corpus Christi LNG, “the liquefaction project is being designed for three trains with expected aggregate nominal production capacity of up to 13.5 million tonnes per annum (mtpa) of LNG.” Therefore, the emissions enabled by this project are estimated to be: 13.5 million tonnes per annum of LNG x 30 years x 75% (assumed capacity factor) x 48.028 unit conversion (million tonnes of LNG to billion cubic feet of gas) x 1,000,000 (billion cubic feet of gas to thousand cubic feet of gas) x 53.12 kg CO2-e per thousand cubic feet natural gas (US EIA emissions factor) x 0.001 (kg CO2 to tonnes of CO2) = 775 million tonnes of CO2.
Freeport LNG Train 2
Freeport LNG Train 2 would have capacity to liquefy up to 4.4 million tonnes of gas each year. Therefore, the emissions enabled by this project are estimated to be: 4.4 million tonnes per annum of LNG x 30 years x 75% (assumed capacity factor) x 48.028 unit conversion (million tonnes of LNG to billion cubic feet of gas) x 53.12 kg CO2-e per thousand cubic feet natural gas (US EIA emissions factor) x 0.001 (kg CO2 to tonnes of CO2) = 252.6 million tonnes of CO2.
Pluto LNG Train 2
Woodside reports Pluto LNG Train 2 would liquefy up to 5 million tonnes per annum of gas. Therefore, the emissions enabled by this project are estimated to be: 5 million tonnes per annum of LNG x 30 years x 75% (assumed capacity factor) x 1.36 million tonnes of LNG to billion cubic metres of gas (BP conversion factor) x 10^9 (billion cubic metres of gas to cubic metres of gas) x 2.03574 kg CO2-e per cubic metre of gas (NGER Technical Guidelines 2017-18) x 0.001 (kg CO2 to tonnes of CO2) = 311.5 million tonnes of CO2.
Note: According to Woodside, Pluto LNG Train 2 “would provide a clear pathway to the low-cost development of the Scarborough resources”. In other words, Woodside plans to use Pluto LNG Train 2 to process gas from its proposed Scarborough gas fields. According to Woodside’s own figures, combined Scope 1 and 3 lifetime emissions from the Scarborough gas fields would be 878 Mt of CO2-e, far greater than our estimate for Pluto Train 2. Further, both Scarborough and Pluto LNG Train 2 are part of Woodside’s Burrup Hub ‘vision’. According to Woodside’s own figures, Scope 1, 2 and 3 lifetime emissions from Burrup Hub projects could be up to 6.88 Gt CO2-e, nearly 13 times Australia’s total greenhouse gas emissions for calendar year 2019. This includes up to 1,615 Mt CO2 from the ‘Browse to North West Shelf’ project, 4,394 Mt CO2 from the ‘North West Shelf project extension’ and 878 Mt CO2 from the Scarborough gas fields.
Sabine Pass LNG terminal
Once all six components (‘trains’) of the project are fully constructed, Sabine Pass LNG would have capacity to liquefy 27 million tonnes per annum (mtpa) of gas. It was assumed that the facility would actually liquefy 20 mtpa (approx 75% capacity) of gas, on average, over 30 years. This amounts to 600 million tonnes of LNG over the lifetime of the project. Based on information sourced from Prometheus Energy, one tonne of LNG equals 621 LNG gallons, resulting in 372.6 billion LNG gallons processed over the lifetime of the project. The same source supplies a conversion factor of 1 LNG gallon = 82.6 cubic feet of gas. Therefore, 372.6 billion LNG gallons is equivalent to 30.77676 tcf of gas processed over the lifetime of the project. The US EIA supplies an emissions factor of 53.12 kg CO2/thousand cubic feet natural gas, resulting in the project processing enough gas to emit 1,634,861,491,200 kg CO2. Total: 1.63 billion metric tonnes of CO2 over its lifetime.
Note that these calculations do not account for emissions generated on site during the liquefaction process or upstream in the process of gas extraction or transport.
Ichthys LNG Project
The Terminal is planned to reach a nameplate capacity of 8.9 mtpa LNG and 1.6 mtpa LPG and it was assumed that this facility would liquefy approximately 75% of this capacity, on average, over its 40-year lifetime. This amounts to 267 million tonnes (mt) of LNG and 48 mt of LPG over the lifetime of the project. Based on information sourced from Karoon Energy, one tonne of LNG equals 8.9055 barrels of oil equivalent (boe) and one tonne of LPG equals 8.1876 boe, resulting in 2,377.8 million boe (mmboe) LNG and 393 mmboe LPG over the lifetime of the project. The same source supplies a conversion factor of 1 PJ = 171,937 boe. Therefore, 2,377.8 mmboe LNG is equivalent to 13,829 PJ of LNG, whilst 393 mmboe LPG is equivalent to 2,286 PJ of LPG, over the lifetime of the project. The Australian Government Department of Environment and Energy supplies an emissions factor of 51.53 kg CO2-e/GJ of LNG and 60.60 kg CO2-e/GJ of LPG, resulting in the project processing enough gas to emit 851.14 mt CO2-e over its lifetime.
In addition to the emissions estimate above and according to Ichthys, the project will generate emissions due to “reservoir CO2 and combustion CO2 emitted from the offshore and onshore processing facilities”. In this regard, Ichthys states that “the Ichthys Project is expected to emit approximately 280 Mt of CO2 over its 40-year lifetime.” Total: 1.13 billion tonnes of CO2.
Hong Kong Offshore LNG Terminal Project
The Hong Kong Offshore LNG Terminal Project is an under-construction (as of December 2020 [p.20]) offshore LNG import facility, which would supply Hong Kong’s Black Point and Lamma gas-fired power stations.
According to Argus Media and Xinde Marine News, the facility can send out up to 4 mtpa LNG. There are already 1.2 mtpa of LNG supply arrangements in place, with additional “unspecified volumes of LNG” set to be contracted upon project completion. So it appears the facility will import and distribute more than 1.2 mtpa LNG, though it’s unclear how much more and for how long. In the absence of further information, it was assumed the project will operate at an average 50% capacity (i.e. process 2 mtpa) over its lifetime.
While the project’s environmental impact assessment (EIA) notes the design life of certain individual project components, it doesn’t clarify the design life of a critical component known as the ‘FSRU vessel’. It was assumed the design life of the FSRU vessel is 20 years, as according to Business Solutions Group’s Augusto Bulte, Midstream and LNG Manager for America (as of April 2017): “Technically an FSRU can be operative 20 years after building it, possibly more with the appropriate overhauling”.
Therefore, the project would import, re-gasify and distribute 40 million tonnes of LNG over its lifetime. 40 mt LNG contains 2,217 petajoules (PJ) of energy (Santos Conversion Calculator), equivalent to 2.217 billion gigajoules (GJ). Upon combustion, 1 GJ of LNG releases 51.53 kg CO2-e (‘National Greenhouse Accounts Factors’, Australian Government Department of Industry, Science, Energy and Resources, 2020). Therefore, combustion of gas imported via the Hong Kong Offshore LNG Terminal Project would result in emissions of approximately 2,217,000,000 x 51.53 kg CO2-e = 114 million tonnes of CO2.
Some of the gas from this project will supply Black Point Power Station, which is another project funded by ANZ. To avoid double counting emissions, we estimate the additional emissions associated with ANZ’s funding of this project to be 114 – 26 = 88 million tonnes of CO2 (estimated lifetime emissions enabled by Hong Kong Offshore LNG Terminal minus estimated lifetime emissions from Black Point Power Station).
Oil and gas drilling
Johan Sverdrup oil field
Gross 2P reserves at Johan Sverdrup were 2,279 MMBoe (515 MMBoe net 2P reserves ÷ 22.6% Lundin Petroleum working interest). The field is 95% oil and 5% gas and natural gas liquids. This equates to 2,165 MMBo and 114 MMBoe gas. One barrel of oil releases 0.43 metric tons of CO2 when combusted. Therefore, emissions from the oil portion of the field are 2,165 MMBo x 0.43 = 931 million tonnes of CO2. 114 MMBoe is equivalent to 6.612×10^14 Btu or 6.612×10^9 therms. Natural gas releases 0.005302 tonnes CO2/ therm when combusted. Therefore, emissions from the gas portion of the field are 6.612×10^9 x 0.005302 = 35 million tonnes of CO2. Total: 966 million tonnes of CO2.
Elk-Antelope gas field
Average certified 2C resource at Elk-Antelope were 6.43 tcf of raw gas. One thousand cubic feet of natural gas releases 53.12 kg of CO2 when combusted. Therefore, Elk-Antelope facilitates emissions of approximately 6.43 x 53.12 x 10^9 kg of CO2. Total: 341.5 million tonnes of CO2.
Medco North Sumatra Block A PSC
According to Medco Energi: “[Block A Aceh] Phase I will monetize 237 TBTU of gas and 5.17 MMBO of condensate for the domestic market” and also “Phase II and III development of gas discoveries with resources of > 5TCF, enough to generate 1.5GW to support Sumatra electricity demand growth”
Using the IEA Unit Converter, the 237 trillion British thermal units (TBTU) of gas from Phase 1 was converted to 250,048,237 gigajoules (GJ). Using the Karoon Energy unit converter, 5.17 million barrels of oil (MMBO) condensate was converted to 29.469 billion cubic feet (BCF) gas-equivalent (1 boe = 5,700 Cubic Feet Gas), which was then converted to 32.12 PJ (1 BCF natural gas = 1.09 PJ) or 32,120,000 GJ. Using the same converter, the 5 TCF (5000 BCF) gas from phases 2 and 3 was converted to 5,450 PJ or 5,450,000,000 GJ. Therefore, total estimated gas development represents 5,732,168,237 GJ gas.
One GJ of natural gas releases 51.53 kg CO2-e when combusted. Therefore, Block A Aceh was estimated to facilitate emissions of approximately 5,732,168,237 x 51.53 kg of CO2. Total: 295 million tonnes of CO2.
Senoro gas field phase 2
Medco reported 329.7 billion cubic feet (bcf) of 2P gas reserves in 2018. Given Medco owns 30% of Senoro and reports reserves in net terms, the overall reserves at Senoro are 329.7 / 30% = 1099 bcf gas (this is consistent with Medco’s previous reporting that ‘gross proved reserves’ at Senoro are 1.4 trillion cubic feet of gas). Senoro Phase 2 is expected to increase production from 310 to 410 million standard cubic feet per day (mmscfd) of gas. Therefore it was assumed the proportion of reserves attributable to Phase 2 was at least (140/450 =) 31%. Medco reports 55 mmscfd of 310 mmscfd (18%) of gas production is bought by fertilizer manufacturers. Therefore it was assumed only 82% of gas is intended for combustion. Therefore, the emissions enabled by this project are estimated to be: 1099 bcf gas x 31% (assumed proportion of gas attributable to Phase 2) x 82% (assumed proportion of gas for combustion) x 1000,000 (billion to thousand cubic feet of gas) x 53.12 kg CO2-e per thousand cubic feet natural gas (US EIA emissions factor) x 0.001 (kg CO2 to tonnes of CO2) = 15 million tonnes of CO2.
Cambo oil and gas fields
Siccar Point Energy stated the Cambo oil and gas field “contains over 800 million barrels of oil … Phase 1 will target c.170mmBOE [million barrels of oil-equivalent] of reserves.” The 170 mmboe reserve estimate was split 50:50 between oil and gas outputs as no public information was found on the estimated reserves by product. Therefore, the emissions from the gas portion of the field are estimated to be:
Gas portion: 170 (mmBOE reserves) x 50% (gas portion) x 0.17 mmBOE to billion cubic metres of gas (BP conversion factor) x 2.031 kg CO2-e per cubic metre of natural gas (UK Government greenhouse gas conversion factors) x 0.001 (kg CO2 to tonnes of CO2)
Oil portion: 170 (mmBOE reserves) x 50% (oil porton) x 1,000,000 (mmBOE to BOE) x 0.43 metric tonnes CO2 per BOE (US EPA)
Gas portion + oil porton = 65.9 million tonnes of CO2.
Tolmount gas field
According to Premier Oil, the Tolmount gas field would produce around 500 billion cubic feet (bcf) of gas. Therefore, the emissions from the gas portion of the field are estimated to be: 500 bcf gas x 10^9 (billion cubic feet of gas to cubic feet of gas) x 0.028 cubic feet of gas to cubic metres of gas (BP conversion factor) x 2.031 kg CO2-e per cubic metre of natural gas (UK Government greenhouse gas conversion factors) x 0.001 (kg of CO2 to tonnes of CO2) = 28.4 million tonnes of CO2.
Project Atlas and Roma North gas fields
In October 2018, Senex Energy announced it received $150 million from ANZ to “fund expansionary capital expenditure across its Surat Basin and Cooper Basin oil and gas acreage.” On the day this deal was closed, Senex announced it had made a ‘final investment decision’ to develop the Project Atlas and Roma North gas fields in the Surat Basin. 3 months before the deal closed, Senex Energy identified 300 PJ in undeveloped 2P reserves at its Project Atlas and Roma North gas fields. Senex reports that its 2P reserves consist of 7% oil and 93% gas across all projects. As oil represents a minor portion of total production and for simplicity, all reserves were treated as natural gas, which made no material difference to the emissions estimates. Therefore, the emissions from the gas portion of the field are estimated to be: 300 PJ gas x 1,000,000 PJ gas to GJ gas x 51.8 kg CO2-e/GJ of gas (NGER Technical Guidelines 2017-18) x 0.001 (kg of CO2 to tonnes of CO2) = 15.5 million tonnes of CO2.
Sole Gas Field
The Sole Gas Field is assessed to contain proved and probable reserves of 249 PJ of sales gas. One gigajoule (GJ) of natural gas releases 51.53 kg CO2-e when combusted. Therefore, the Sole Gas Field facilitates emissions of approximately 249 x 10^6 x 51.53 kg of CO2. Total: 12.8 million tonnes of CO2.
Barossa/Caldita gas field
Barossa is an offshore gas field. The gas from this project would be liquefied at the Darwin LNG liquefaction facility and exported. As such, the project’s owners typically refer to the gas produced from Barossa as ‘LNG’.
According to official project documents, the project would have “a production rate of approximately 3.7 Mtpa of LNG, and approximately 1.5 MMbbl/yr of condensate” and an operating life of 25 years. Therefore, over its lifetime the project would produce 92.5 million tonnes (mt) of LNG and 37.5 million barrels (MMbbl) of condensate.
Regarding the LNG component, 92.5 mt LNG contains 5,127 petajoules (PJ) of energy (Santos Conversion Calculator), equivalent to 5.127 billion gigajoules (GJ). Upon combustion, 1 GJ of LNG releases 51.53 kg CO2-e (‘National Greenhouse Accounts Factors’, Australian Government Department of Industry, Science, Energy and Resources, 2020). Therefore, combustion of Barossa gas would result in emissions of approximately 5,127,000,000 x 51.53 kg CO2-e = 264 million tonnes of CO2-e.
37.5 MMbbl of condensate = 4.16 mt of condensate (Santos Conversion Calculator). According to the Australian Government Department of Industry, Science, Energy and Resources National Greenhouse Accounts Factors (2020), each tonne of ‘other natural gas liquids’ (assumed to incorporate natural gas condensate) contains 46.5 GJ of energy. Therefore, 37.5 MMbbl of natural gas condensate contains 193.45 million GJ. Upon combustion, 1 GJ of ‘other natural gas liquids’ releases 61.28 kg CO2-e (‘National Greenhouse Accounts Factors’, Australian Government Department of Industry, Science, Energy and Resources, 2020). Therefore, combustion of Barossa condensate would result in emissions of approximately 193,450,000 x 61.28 kg CO2-e = 11.8 million tonnes of CO2-e.
In addition to the emissions estimates above, emissions will also be generated at the project site. According to the Barossa Offshore Project Proposal (March 2018), “CO2 removal”, “Fuel gas” and “Flaring” will result in 3.38 million tonnes of CO2 being released each year. Over the project’s 25 year operating life, this would result in 84.5 million tonnes of CO2 emissions.
Furthermore, CO2 emissions associated with processing of the gas at Darwin LNG—a facility subject to a US$600 million, 20 year life extension “kick-started” by the Barossa FID—would be 2.05 million tonnes of CO2 each year (Barossa Offshore Project Proposal, as cited by IEEFA), equivalent to a further 41 million tonnes of CO2 over the 20 year life extension.
Total: 401 million tonnes of CO2.
The huge emissions potential associated with this project has led Process Engineer and Industrial Economist John Robert to state “the Barossa to Darwin LNG project looks more like a CO2 emissions factory with an LNG by-product”.
Gas-fired power plants
The average capacity factor for US-based combined cycle gas turbines (CCGT) is approximately 50% (2010-2019) according to the US Energy Information Administration. Given that the majority of new or expanded gas-fired power stations funded by the big four banks were based in the US, we assumed a 50% average capacity factor across a 30-year economic lifetime for all CCGT power stations. Assumed emissions intensity of 0.36 t CO2/MWh – the lowest emissions intensity for this type of gas technology.
Lackawanna emissions = 1480 (MW capacity) x 8760 (hours in the year) x 30 (years) x 0.5 (capacity factor) x 0.36 (t CO2/MWh emissions intensity) = 70,009,920 t CO2. Total: 70 million tonnes of CO2.
AES Corporation portfolio emissions = 1300 (MW capacity) x 8760 (hours in the year) x 30 (years) x 0.5 (capacity factor) x 0.36 (t CO2/MWh emissions intensity) = 61,495,200 t CO2. Total: 61.5 million tonnes of CO2.
Jackson Generation CCGT Plant emissions = 1200 (MW capacity) x 8760 (hours in the year) x 30 (years) x 0.5 (capacity factor) x 0.36 (t CO2/MWh emissions intensity) = 56,764,800 tCO2. Total: 56.8 million tonnes of CO2.
South Field Energy Gas-Fired Power Plant emissions = 1182 (MW capacity) x 8760 (hours in the year) x 30 (years) x 0.5 (capacity factor) x 0.36 (t CO2/MWh emissions intensity) = 55,913,328 tCO2. Total: 55.9 million tonnes of CO2.
Cricket Valley emissions = 1100 (MW capacity) x 8760 (hours in the year) x 30 (years) x 0.5 (capacity factor) x 0.36 (t CO2/MWh emissions intensity) = 52,034,400 t CO2. Total: 52.0 million tonnes of CO2.
CPV Fairview emissions = 1050 (MW capacity) x 8760 (hours in the year) x 30 (years) x 0.5 (capacity factor) x 0.36 (t CO2/MWh emissions intensity) = 49,669,200 t CO2. Total: 49.7 million tonnes of CO2.
Hickory Run emissions = 1000 (MW capacity) x 8760 (hours in the year) x 30 (years) x 0.5 (capacity factor) x 0.36 (t CO2/MWh emissions intensity) = 47,304,000 t CO2. Total: 47.3 million tonnes of CO2.
Westmoreland emissions = 925 (MW capacity) x 8760 (hours in the year) x 30 (years) x 0.5 (capacity factor) x 0.36 (t CO2/MWh emissions intensity) = 43,756,200 kg CO2. Total: 43.7 million tonnes of CO2.
Jawa 2 emissions = 880 (MW capacity) x 8760 (hours in the year) x 30 (years) x 0.5 (capacity factor) x 0.36 (t CO2/MWh emissions intensity) = 41,627,520 t CO2. Total: 41.6 million tonnes of CO2.
Towantic emissions = 785 (MW capacity) x 8760 (hours in the year) x 30 (years) x 0.5 (capacity factor) x 0.36 (t CO2/MWh emissions intensity) = 37,133,640 kg CO2. Total: 37.1 million tonnes of CO2.
Tambak Lorok Combined Cycle Power Plant Block 3 emissions = 780 (MW capacity) x 8760 (hours in the year) x 30 (years) x 0.5 (capacity factor) x 0.36 (t CO2/MWh emissions intensity) = 36,897,120 t CO2. Total: 36.9 million tonnes of CO2.
Black Point emissions = 550 (MW capacity) x 8760 (hours in the year) x 30 (years) x 0.5 (capacity factor) x 0.36 (t CO2/MWh emissions intensity) = 26,017,200 t CO2. Total: 26.0 million tonnes of CO2.
Muara Karang emissions = 500 (MW capacity) x 8760 (hours in the year) x 30 (years) x 0.5 (capacity factor) x 0.36 (t CO2/MWh emissions intensity) = 23,652,000 t CO2. Total: 23.7 million tonnes of CO2.